Back chapter figures
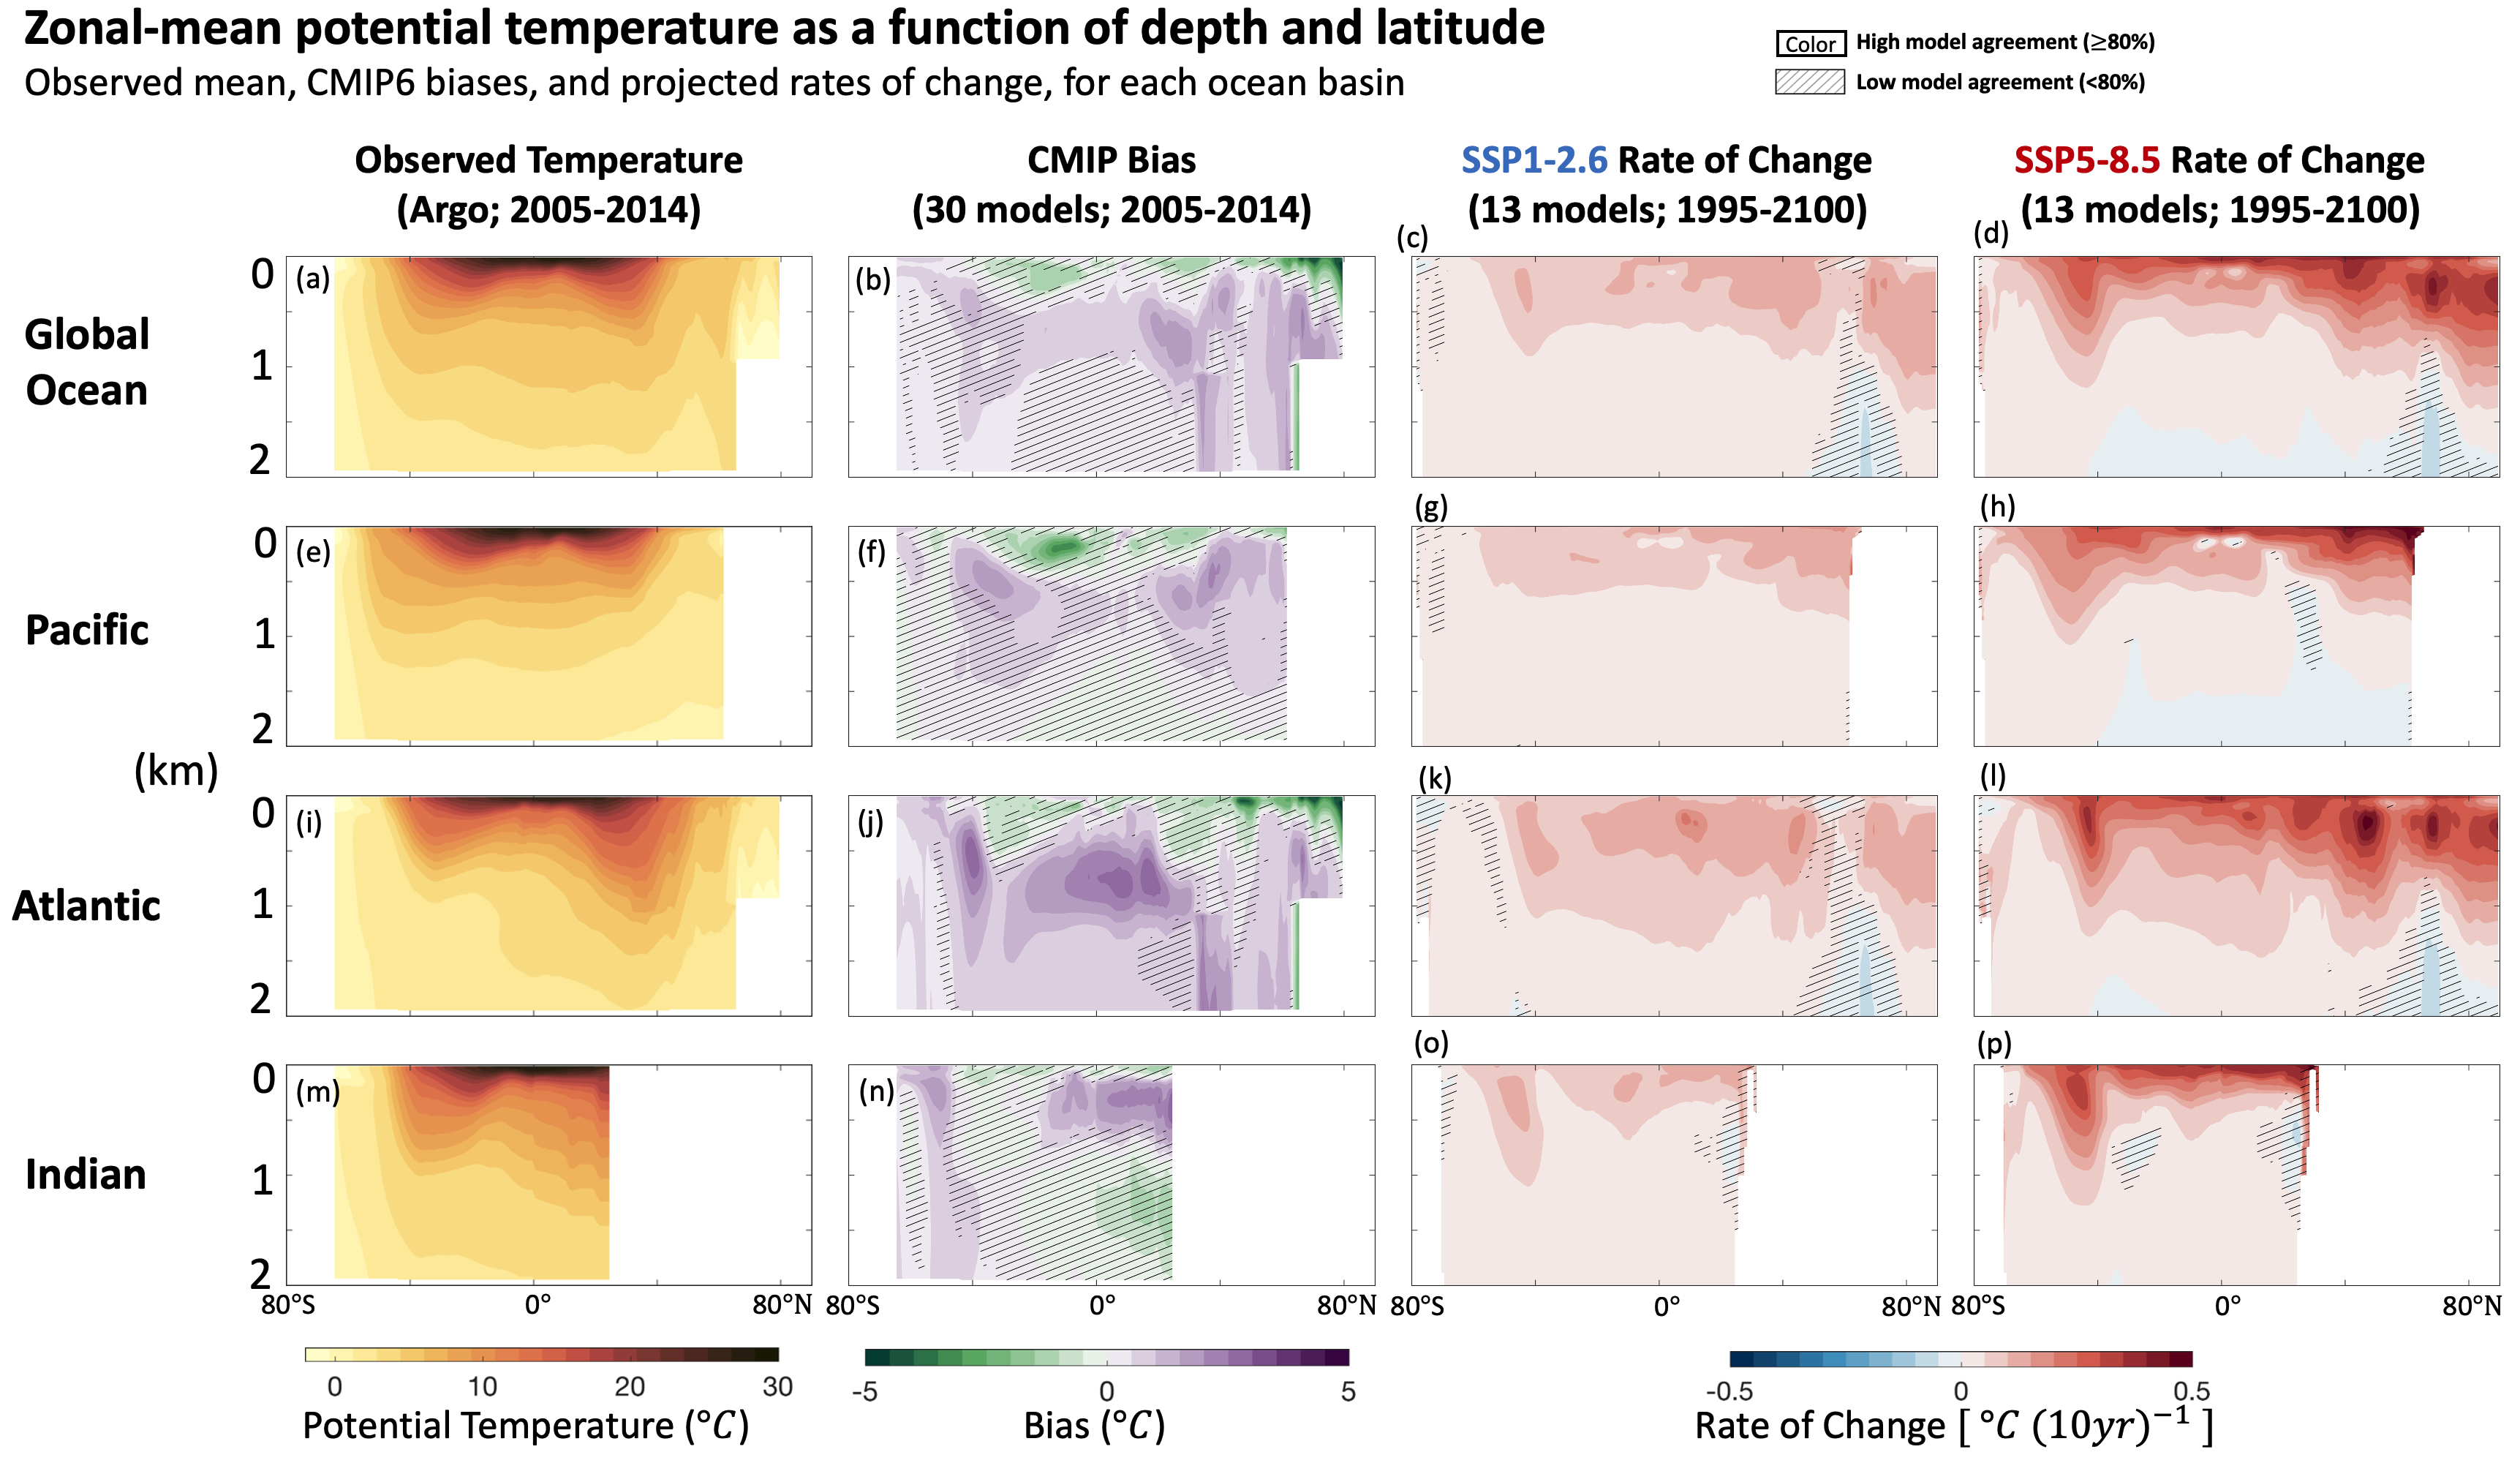
Figure 9.7
Figure caption
Figure 9.7 | Meridional-depth profiles of zonal-mean potential temperature in the ocean and its rate of change in the upper 2000 m of the Global, Pacific, Atlantic and Indian oceans. Shown are (a, e, i, m) observed temperature (Argo climatology 2005–2014), (b, f, j, n) bias of the Coupled Model Intercomparison Project Phase 6 (CMIP6) ensemble over this period, and future changes under (c, g, k, o) SSP1-2.6 and (d, h, l, p) SSP5-8.5. No overlay indicates regions with high model agreement, where ≥80% of models agree on the sign of change. Diagonal lines indicate regions with low model agreement, where <80% of models agree on the sign of change (see Cross-Chapter Box Atlas.1 for more information). Further details on data sources and processing are available in the chapter data table (Table 9.SM.9).
