Back chapter figures
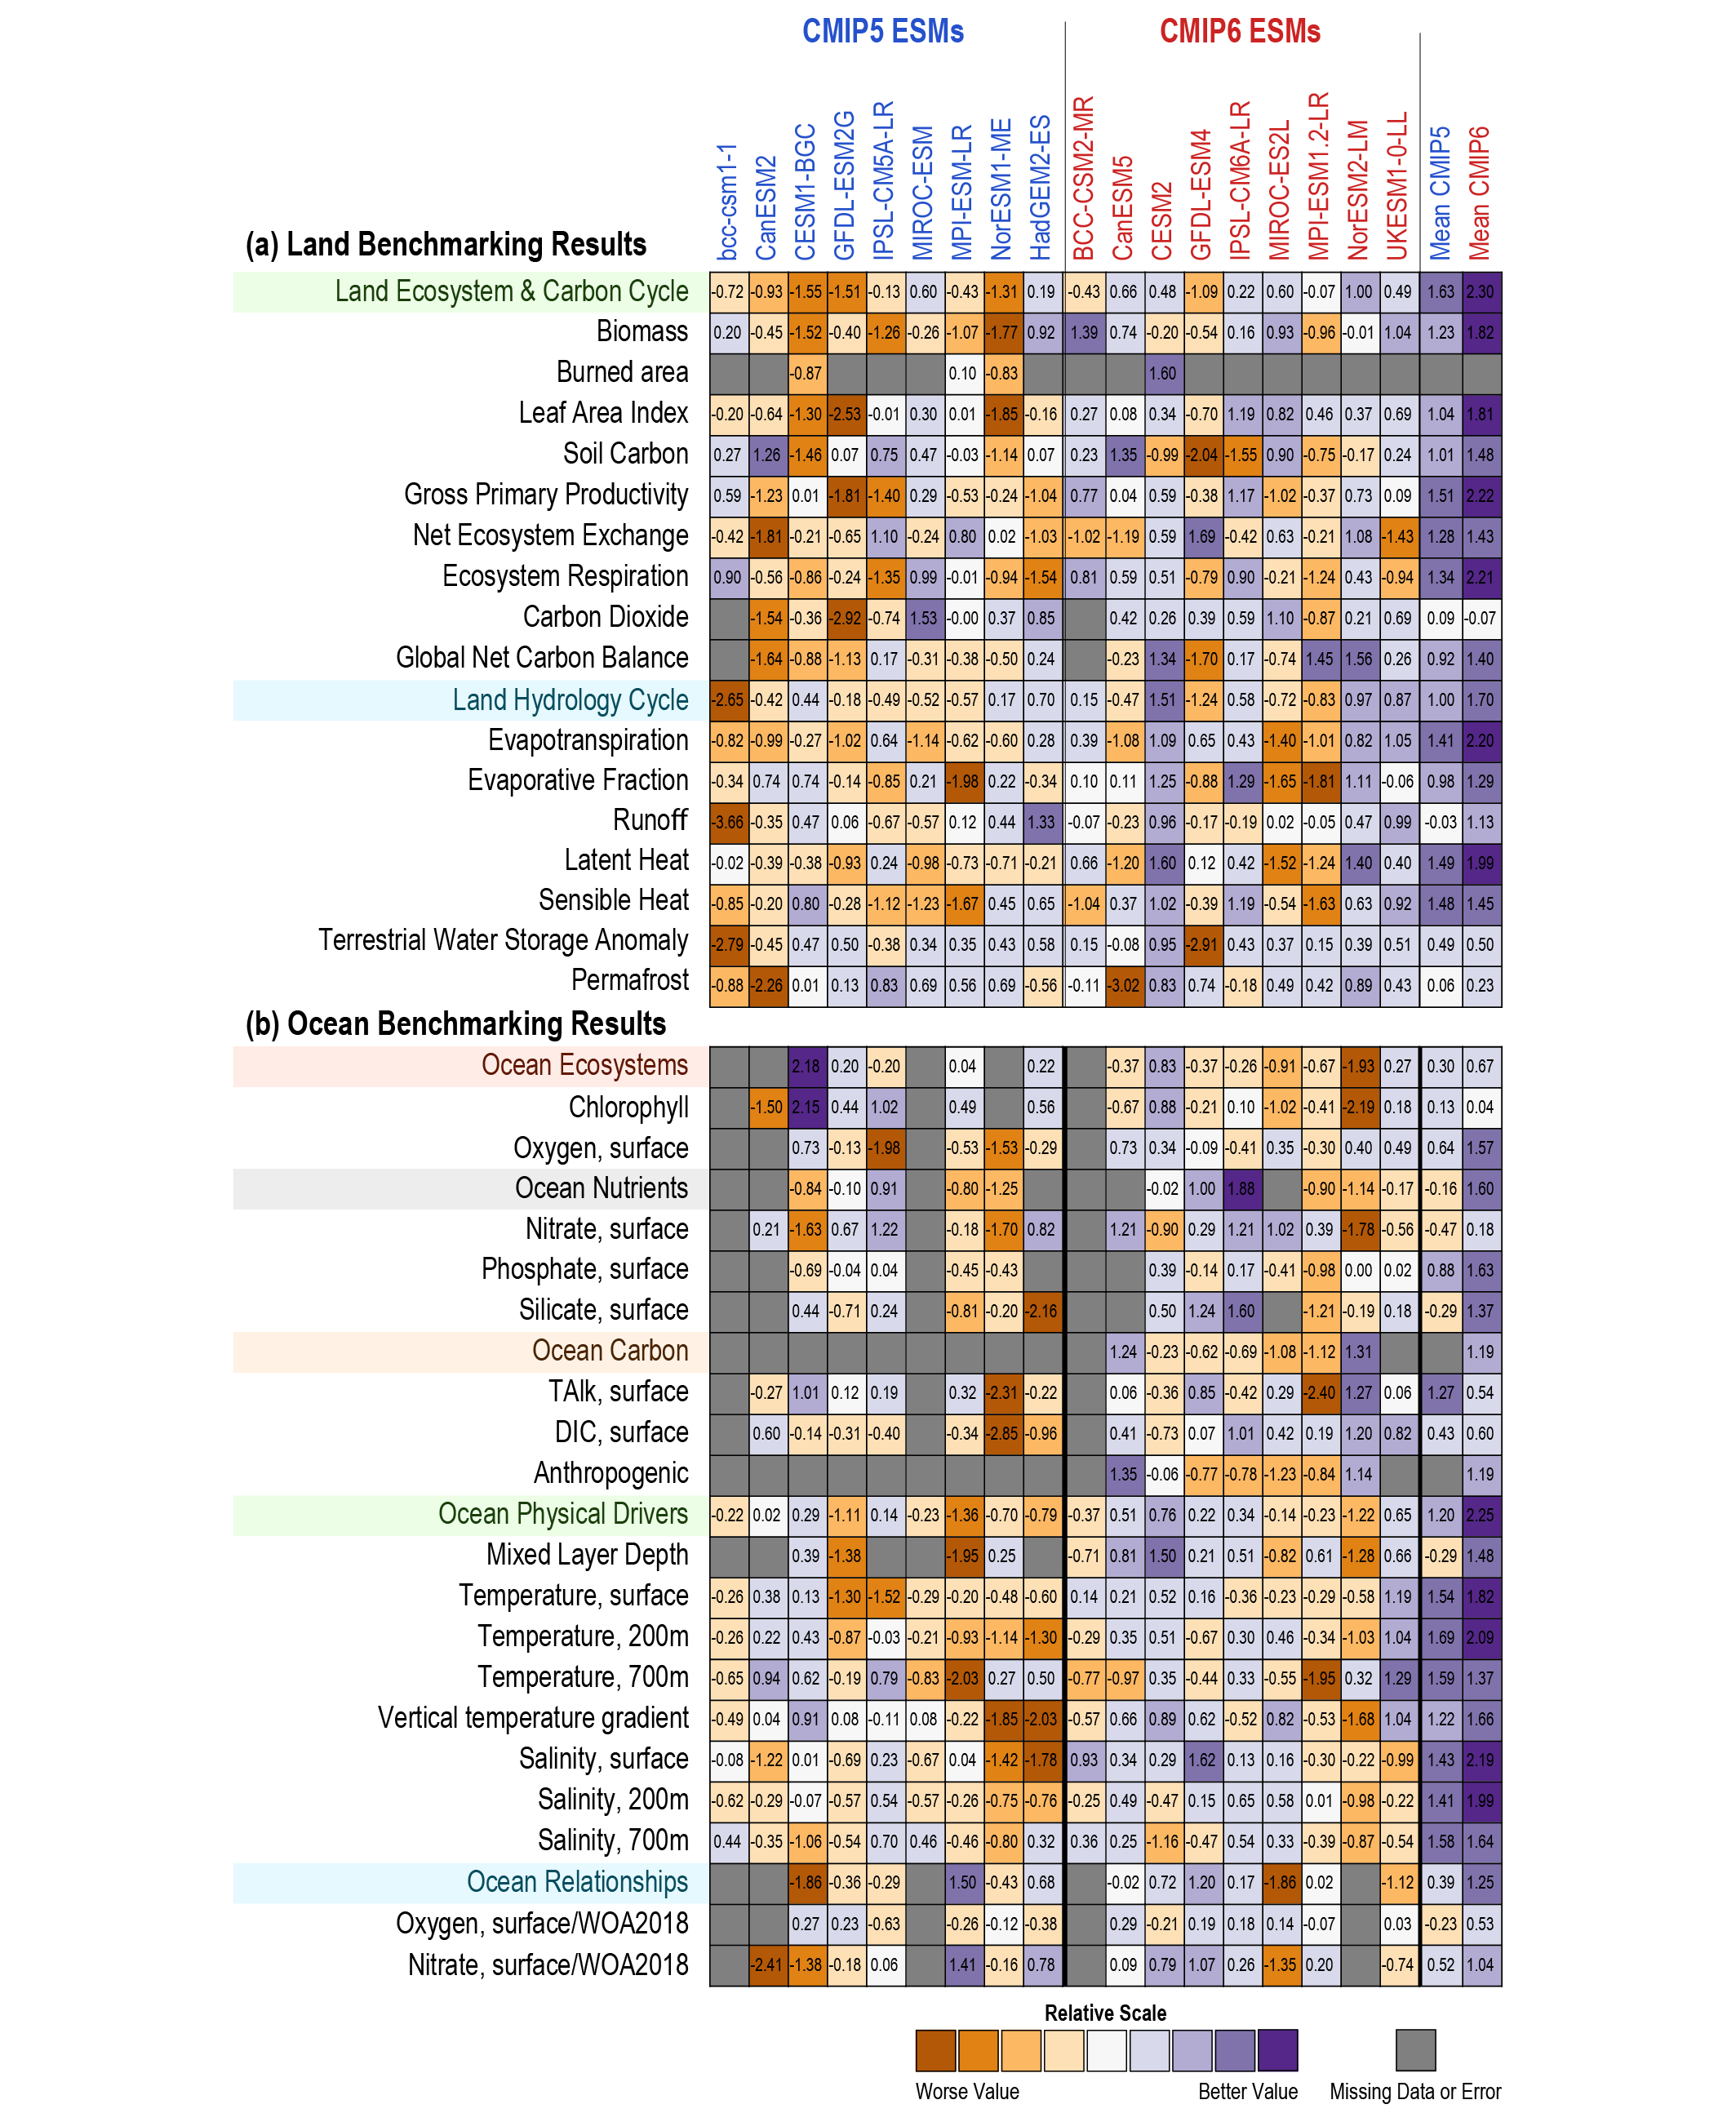
Figure 5.22
Figure caption
Figure 5.22 | Overview scores for CMIP5 (left-hand side of table) and CMIP6 (right-hand side of table) Earth system models (ESMs), for multiple benchmarks against different datasets. (a) Benchmarking of ESM land models; (b) benchmarking of ocean models. Scores are relative to other models within each benchmark row, with positive scores indicating a better agreement with observations. Models included are only those from institutions that participated in both CMIP5 and CMIP6 carbon cycle experiments, in order to trace changes from one ensemble to the next. CMIP5 models are labels in blue and CMIP6 in red. Further details on data sources and processing are available in the chapter data table (Table 5.SM.6).
