Cross-Chapter Box 5.2, Figure 1
Figure caption
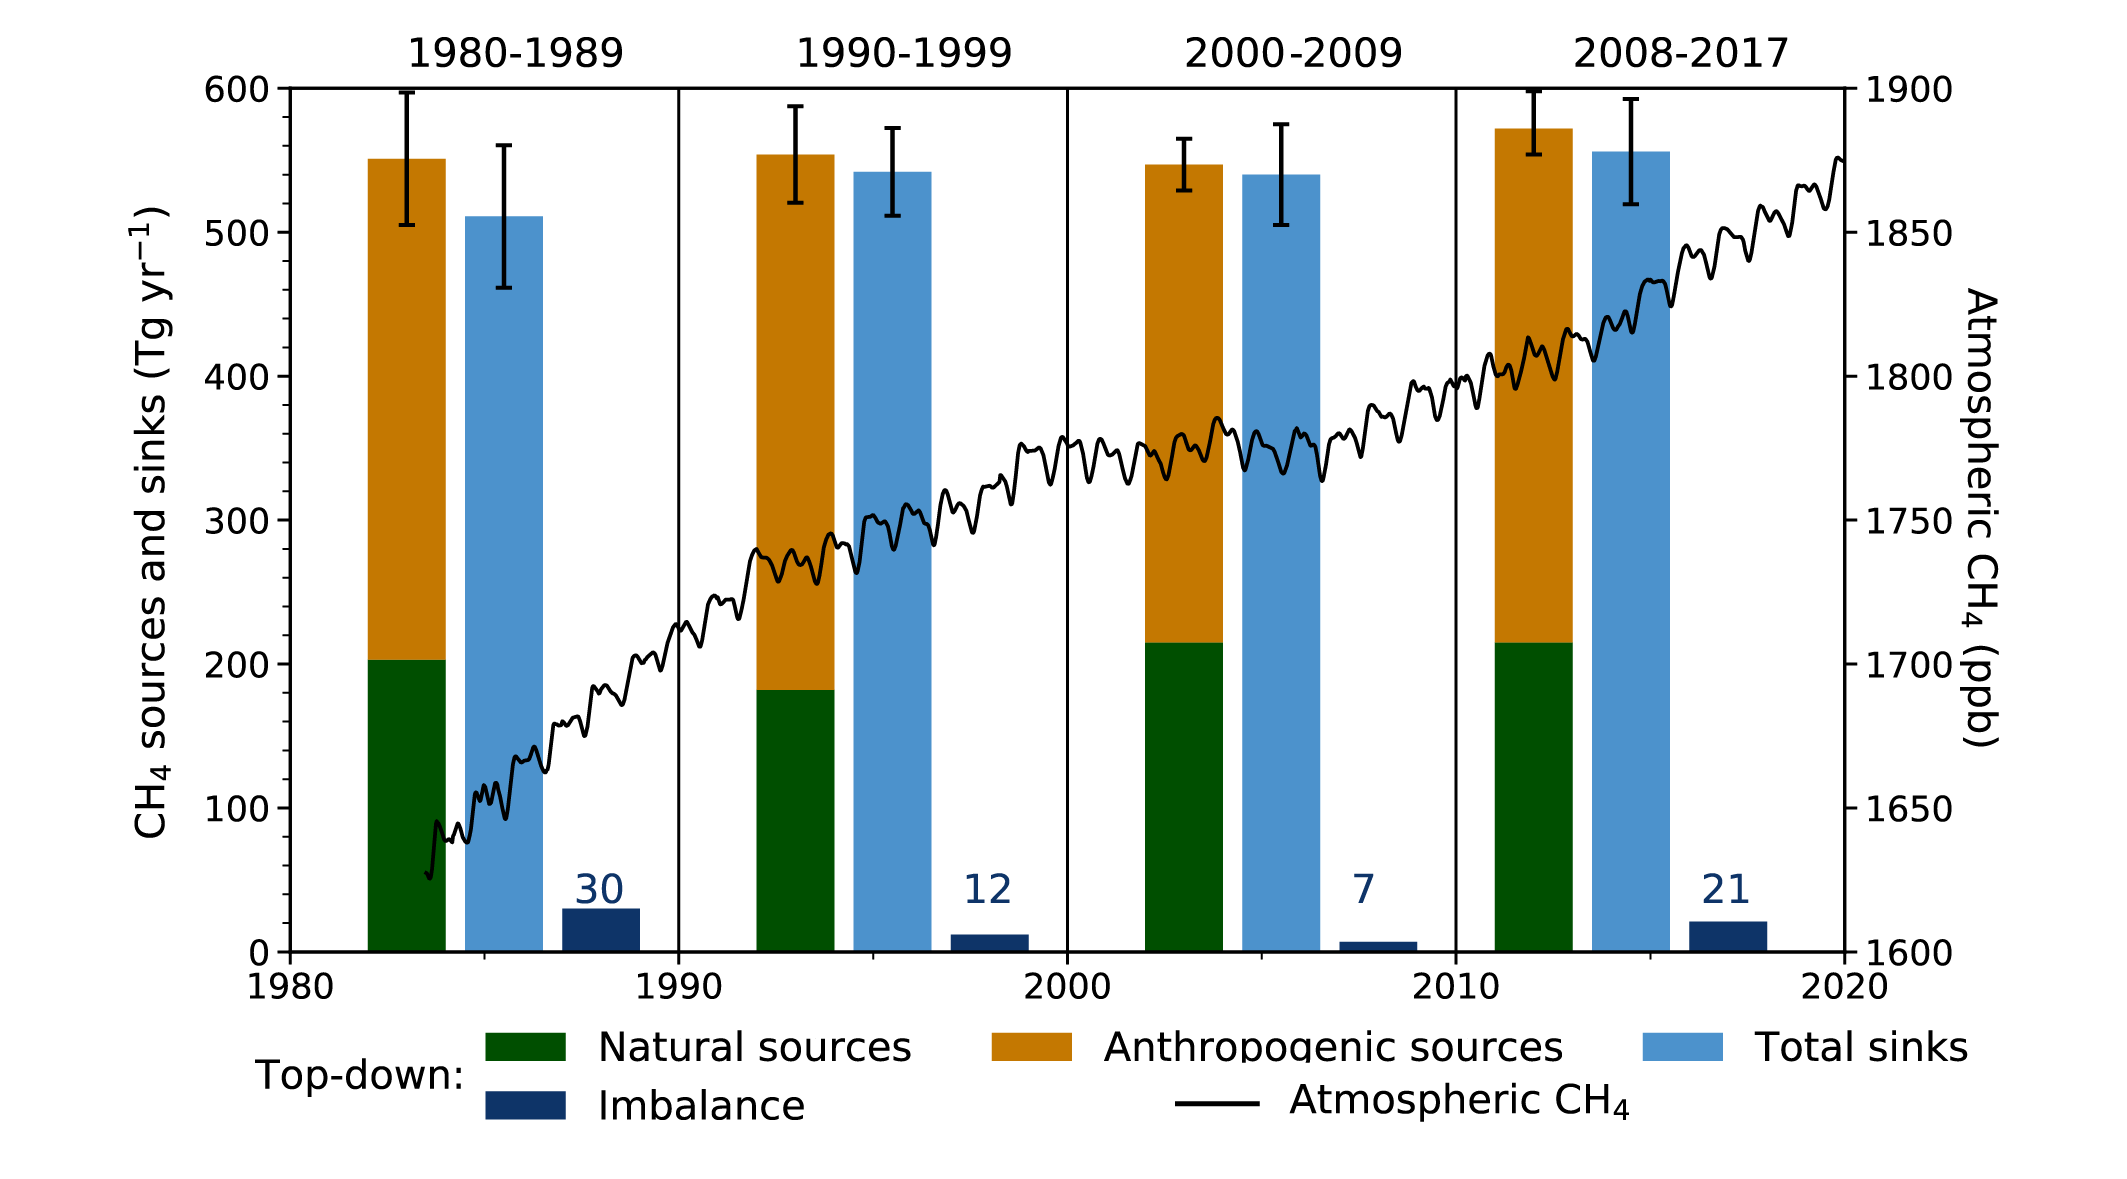
Cross-Chapter Box 5.2, Figure 1 | Methane sources and sinks for four decades from atmospheric inversions with the budget imbalance (source–sink; dark blue bars) (plotted on the left y-axis). Top-down analysis from Kirschke et al. (2013); Saunois et al. (2020). The global CH4 concentration seen in the black line (plotted on the right y-axis), representing National Oceanic and Atmospheric Administration (NOAA) observed global monthly mean atmospheric CH4 in dry-air mole fractions for 1983–2019 (Chapter 2, Annex V). Natural sources include emissions from natural wetlands, lakes and rivers, geological sources, wild animals, termites, wildfires, permafrost soils, and oceans. Anthropogenic sources include emissions from enteric fermentation and manure, landfills, waste and wastewater, rice cultivation, coal mining, oil and gas industry, biomass and biofuel burning. The top-down total sink is determined from global mass balance that includes chemical losses due to reactions with hydroxyl (OH), atomic chlorine (Cl), and excited atomic oxygen (O1D), and oxidation by bacteria in aerobic soils (Table 5.2). Further details on data sources and processing are available in the chapter data table (Table 5.SM.6).
