Back chapter figures
Figure 4.8
Figure caption
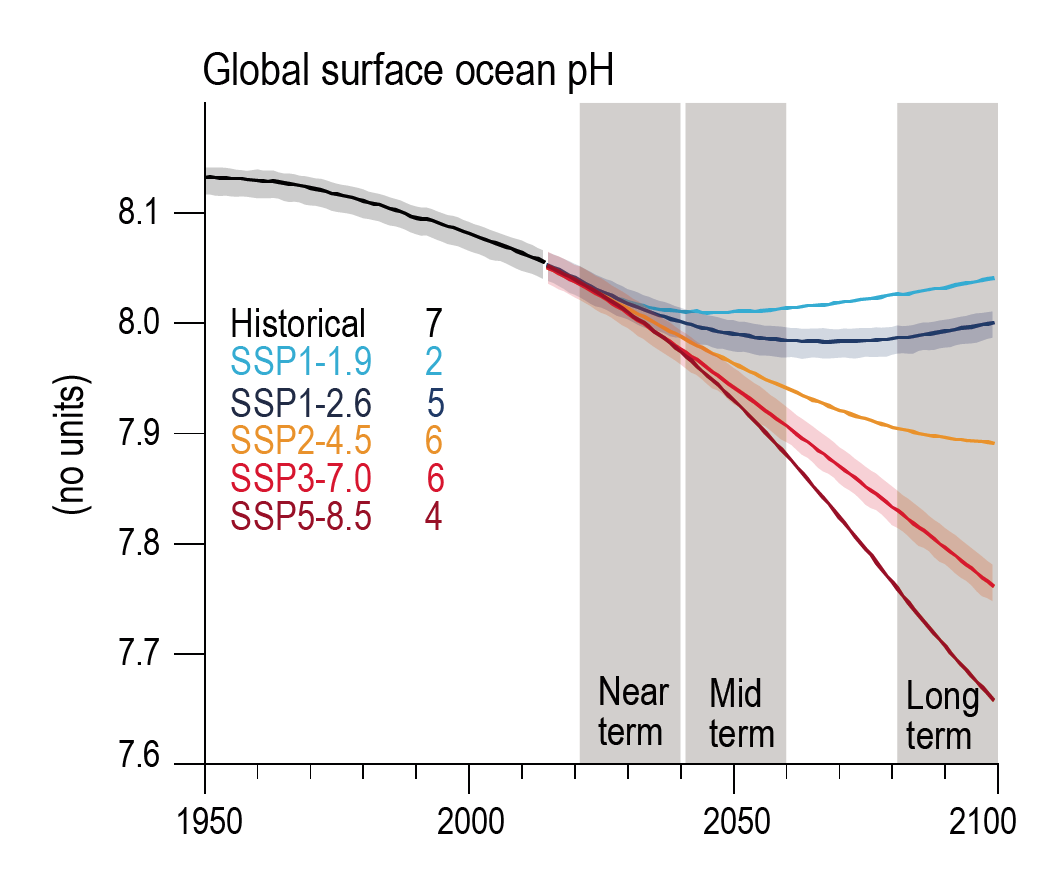
Figure 4.8 | Global average surface ocean pH. The shadings around the SSP1-2.6 and SSP5-7.0 curves are the 5–95% ranges across those ensembles. The numbers inside each panel are the number of model simulations. Results are from concentration-driven simulations. Further details on data sources and processing are available in the chapter data table (Table 4.SM.1).
