Back chapter figures
Figure 4.10
Figure caption
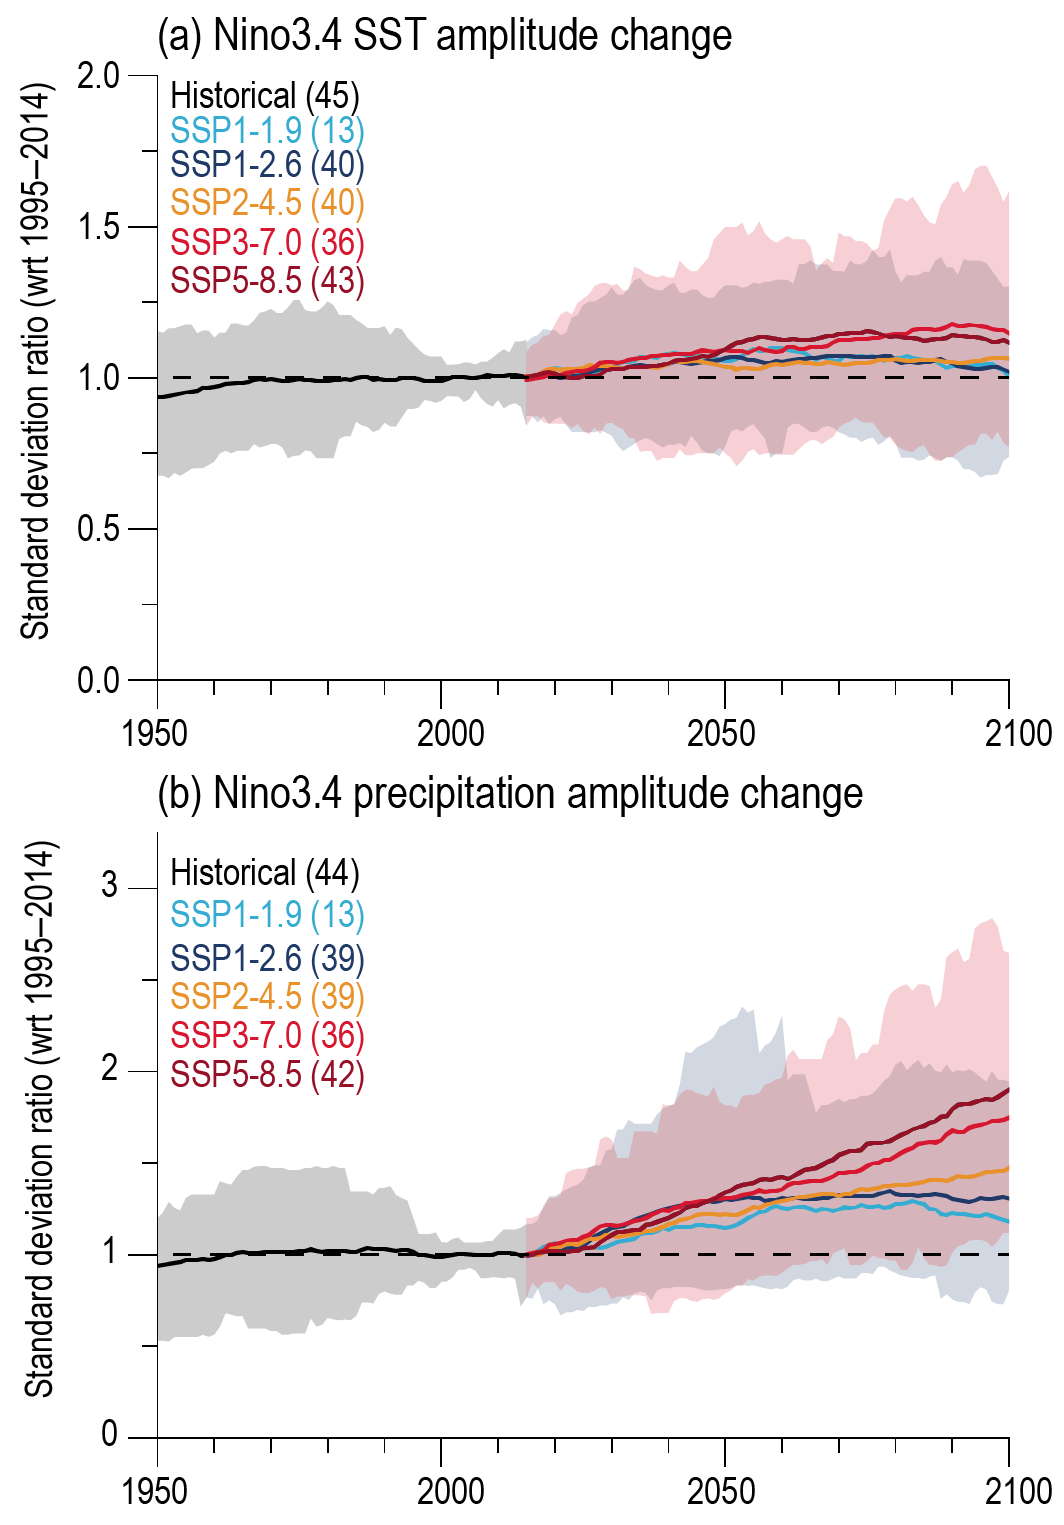
Figure 4.10 | Changes in amplitude of ENSO Variability. Variability of (a) SST and (b) precipitation anomalies averaged over Niño 3.4 region for 1950–2014 from CMIP6 historical simulations and for 2015–2100 from four SSPs. Thick lines stand for multi-model mean and shading is the 5–95% range across CMIP6 models for historical simulation (grey), SSP1-2.6 (blue) and SSP3-7.0 (pink), respectively. The amplitude of ENSO SST and rainfall variability is defined as the standard deviation of the detrended Niño 3.4-area averaged SST and rainfall index, respectively, over 30-year running windows. The standard deviation in every single model is normalized by each model’s present-day standard deviation averaged from 1995 to 2014. The number of available models is listed in parentheses. This figure is adopted from Yun et al. (2021). Further details on data sources and processing are available in the chapter data table (Table 4.SM.1).
