Back chapter figures
Figure 3.19
Figure caption
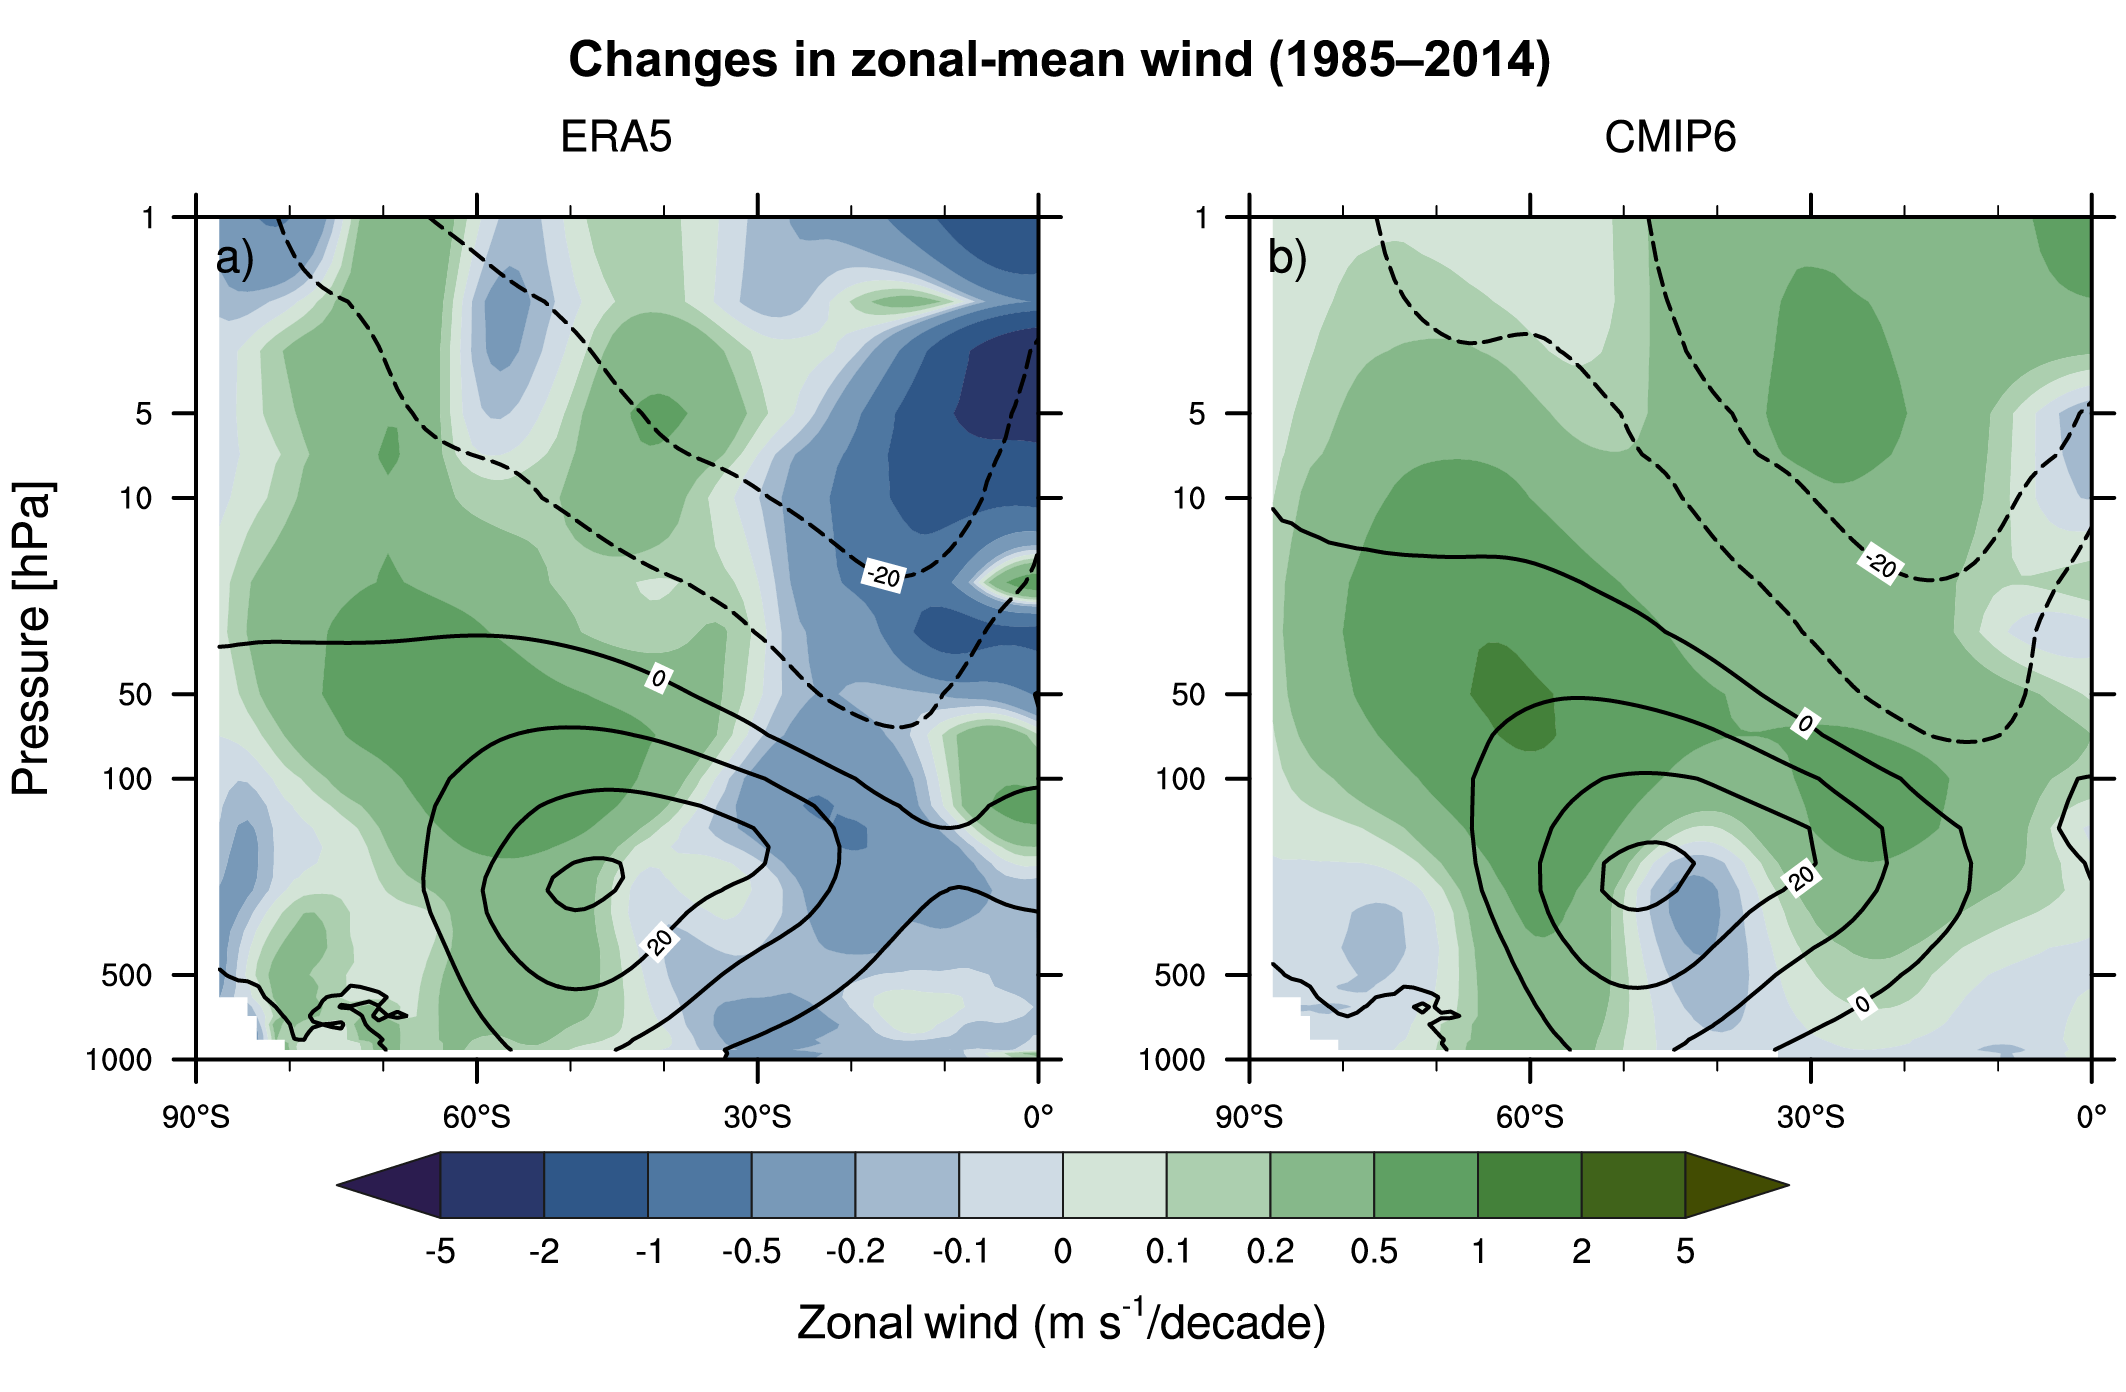
Figure 3.19 | Long-term mean (thin black contours) and linear trend (colour) of zonal mean December–January–February zonal winds from 1985 to 2014 in the Southern Hemisphere. The figure shows (a) ERA5 and (b) the CMIP6 multi-model mean (58 CMIP6 models). The solid contours show positive (westerly) and zero long-term mean zonal wind, and the dashed contours show negative (easterly) long-term mean zonal wind. Only one ensemble member per model is included. Figure is modified from Eyring et al. (2013), their Figure 12. Further details on data sources and processing are available in the chapter data table (Table 3.SM.1).
