Back chapter figures
Figure 2.38
Figure caption
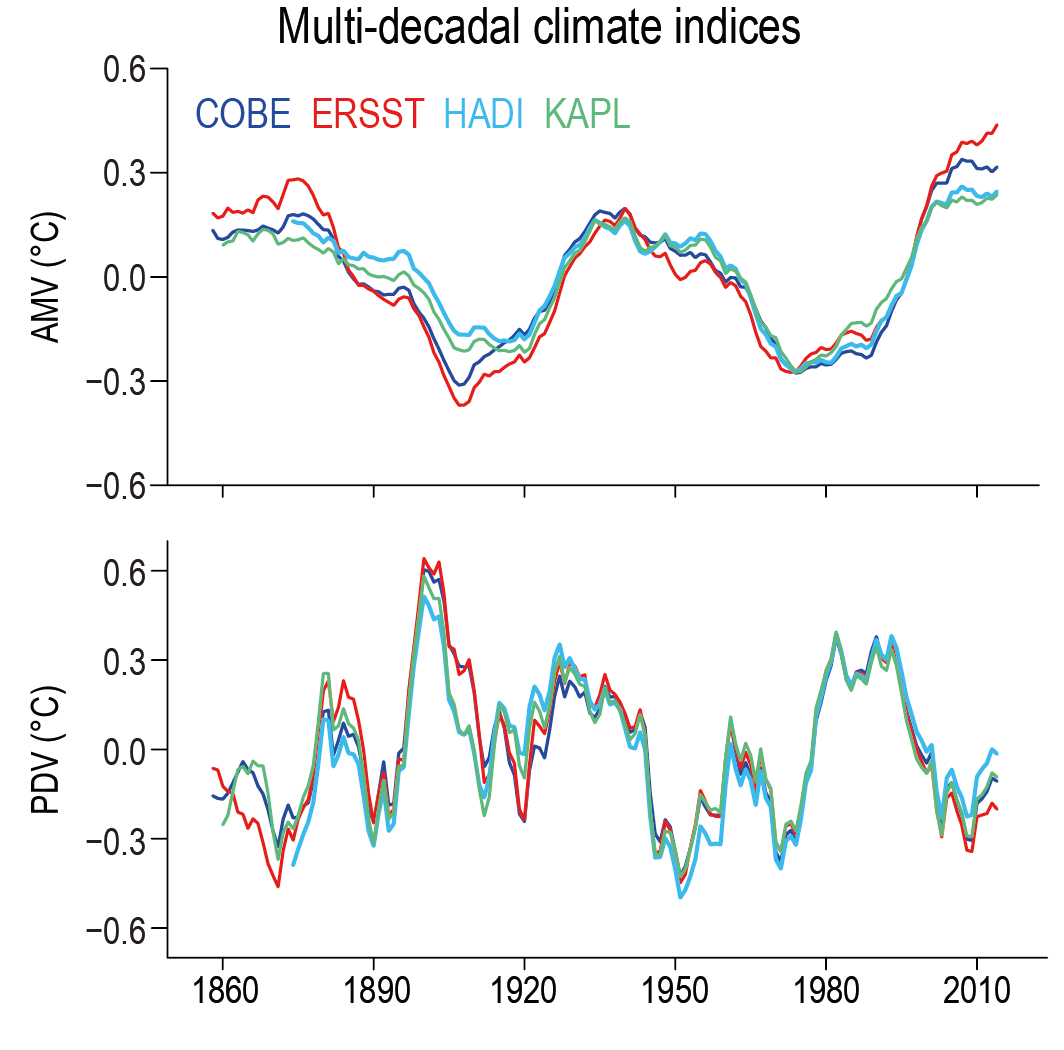
Figure 2.38 | Indices of multi-decadal climate variability from 1854–2019 based upon several sea surface temperature data products. Shown are the indices of the AMV and PDV based on area averages for the regions indicated in Annex IV. Further details on data sources and processing are available in the chapter data table (Table 2.SM.1).
