Back chapter figures
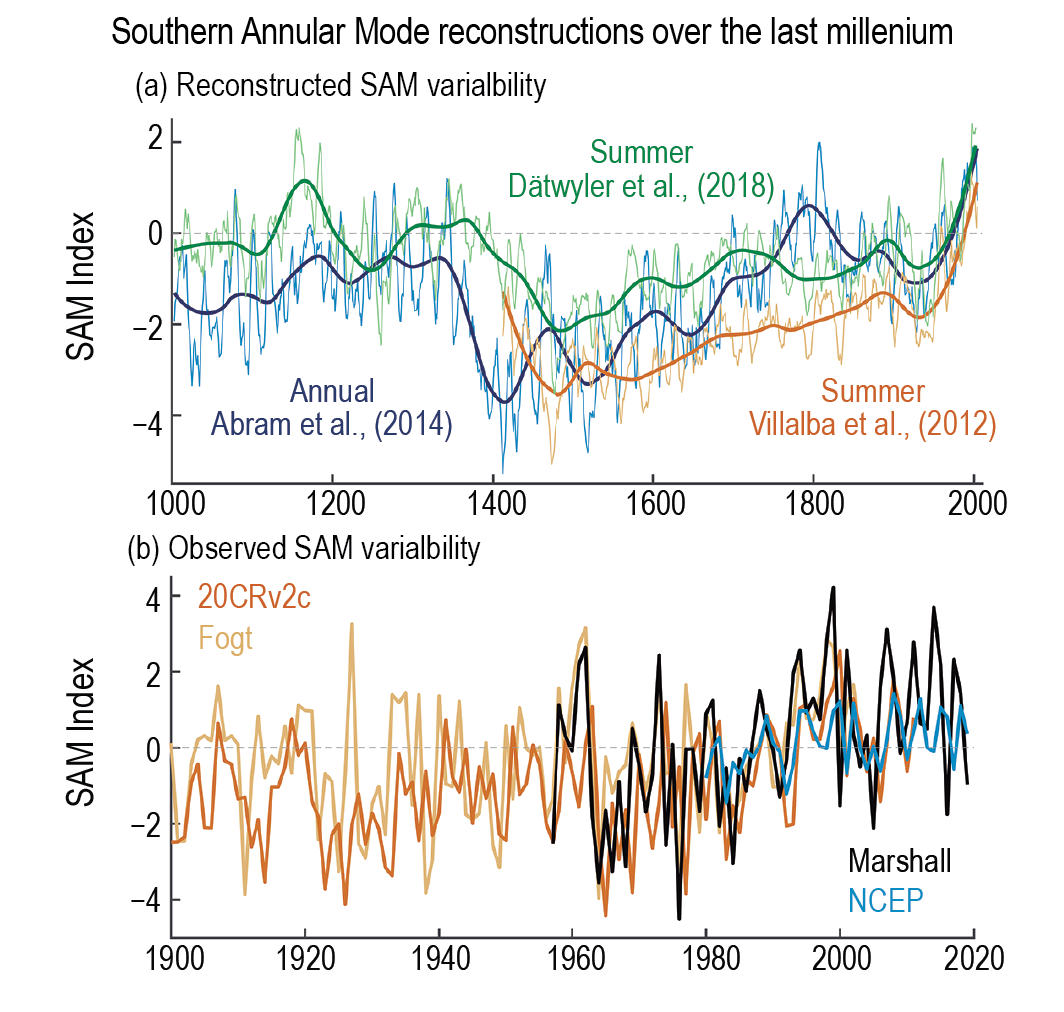
Figure 2.35
Figure caption
Figure 2.35 | Southern Annular Mode (SAM) reconstruction over the last millennium. (a) SAM reconstructions as seven-year moving averages (thin lines) and 70-year LOESS filter (thick lines). (b) Observed SAM index during 1900–2019. Further details on data sources and processing are available in the chapter data table (Table 2.SM.1).
