Back chapter figures
Figure 11.12
Figure caption
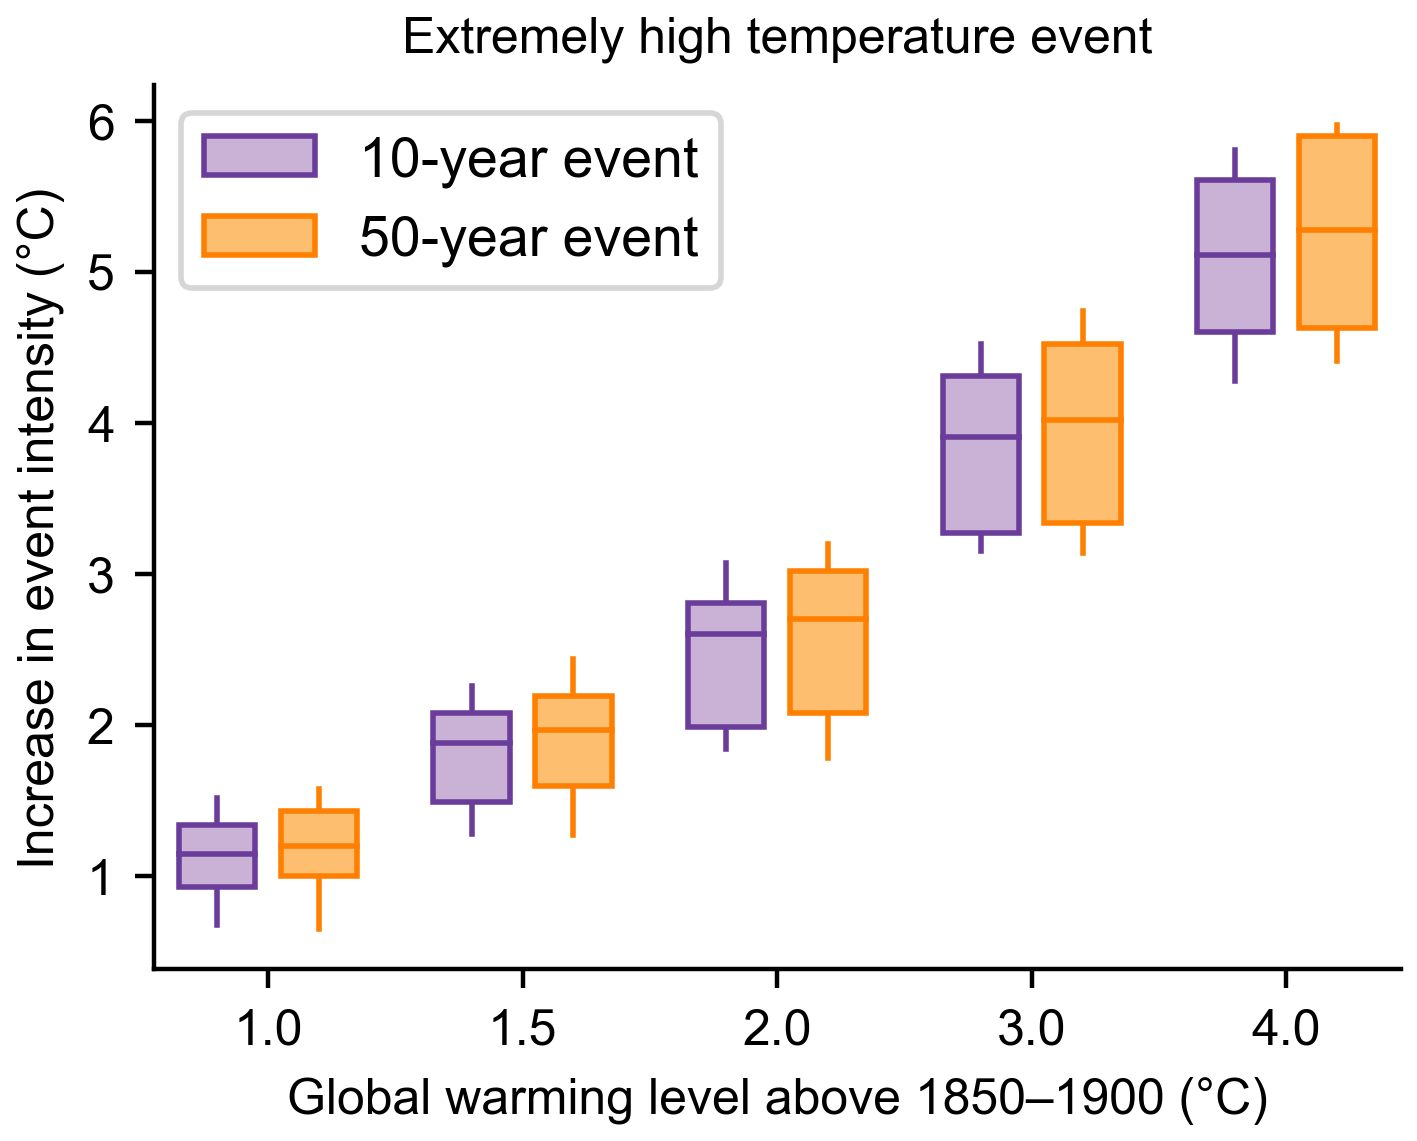
Figure 11.12 | Projected changes in the intensity of extreme temperature events under 1°C, 1.5°C, 2°C, 3°C, and 4°C global warming levels relative to the 1850–1900 baseline. Extreme temperature events are defined as the daily maximum temperatures (TXx) that were exceeded on average once during a 10-year period (10-year event, blue) and once during a 50-year period (50-year event, orange) during the 1850–1900 base period. Results are shown for the global land. For each box plot, the horizontal line and the box represent the median and central 66% uncertainty range, respectively, of the intensity changes across the multi-model ensemble, and the ‘whiskers’ extend to the 90% uncertainty range. The results are based on the multi-model ensemble from simulations of global climate models contributing to the Coupled Model Intercomparison Project Phase 6 (CMIP6) under different Shared Socio-economic Pathway forcing scenarios. Adapted from Li et al. (2021). Further details on data sources and processing are available in the chapter data table (Table 11.SM.9).
