Back chapter figures
Box 11.4 Figure 1
Figure caption
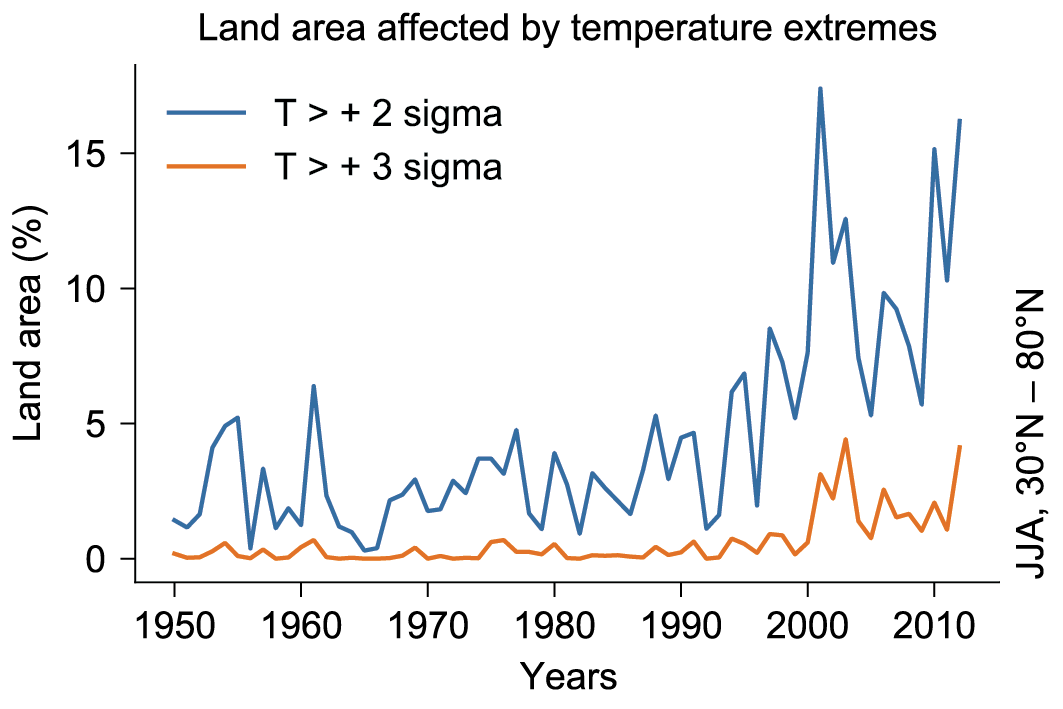
Box 11.4, Figure 1 | | Analysis of the percentage of land area affected by temperature extremes larger than two (blue) or three (orange) standard deviations in June–July–August (JJA) between 30°N and 80°N using a normalization. This figure shows a substantial increase in the overall land area affected by very strong hot extremes since 1990. Adapted from Sippel et al. (2015).
