Figure SPM.5
Figure caption
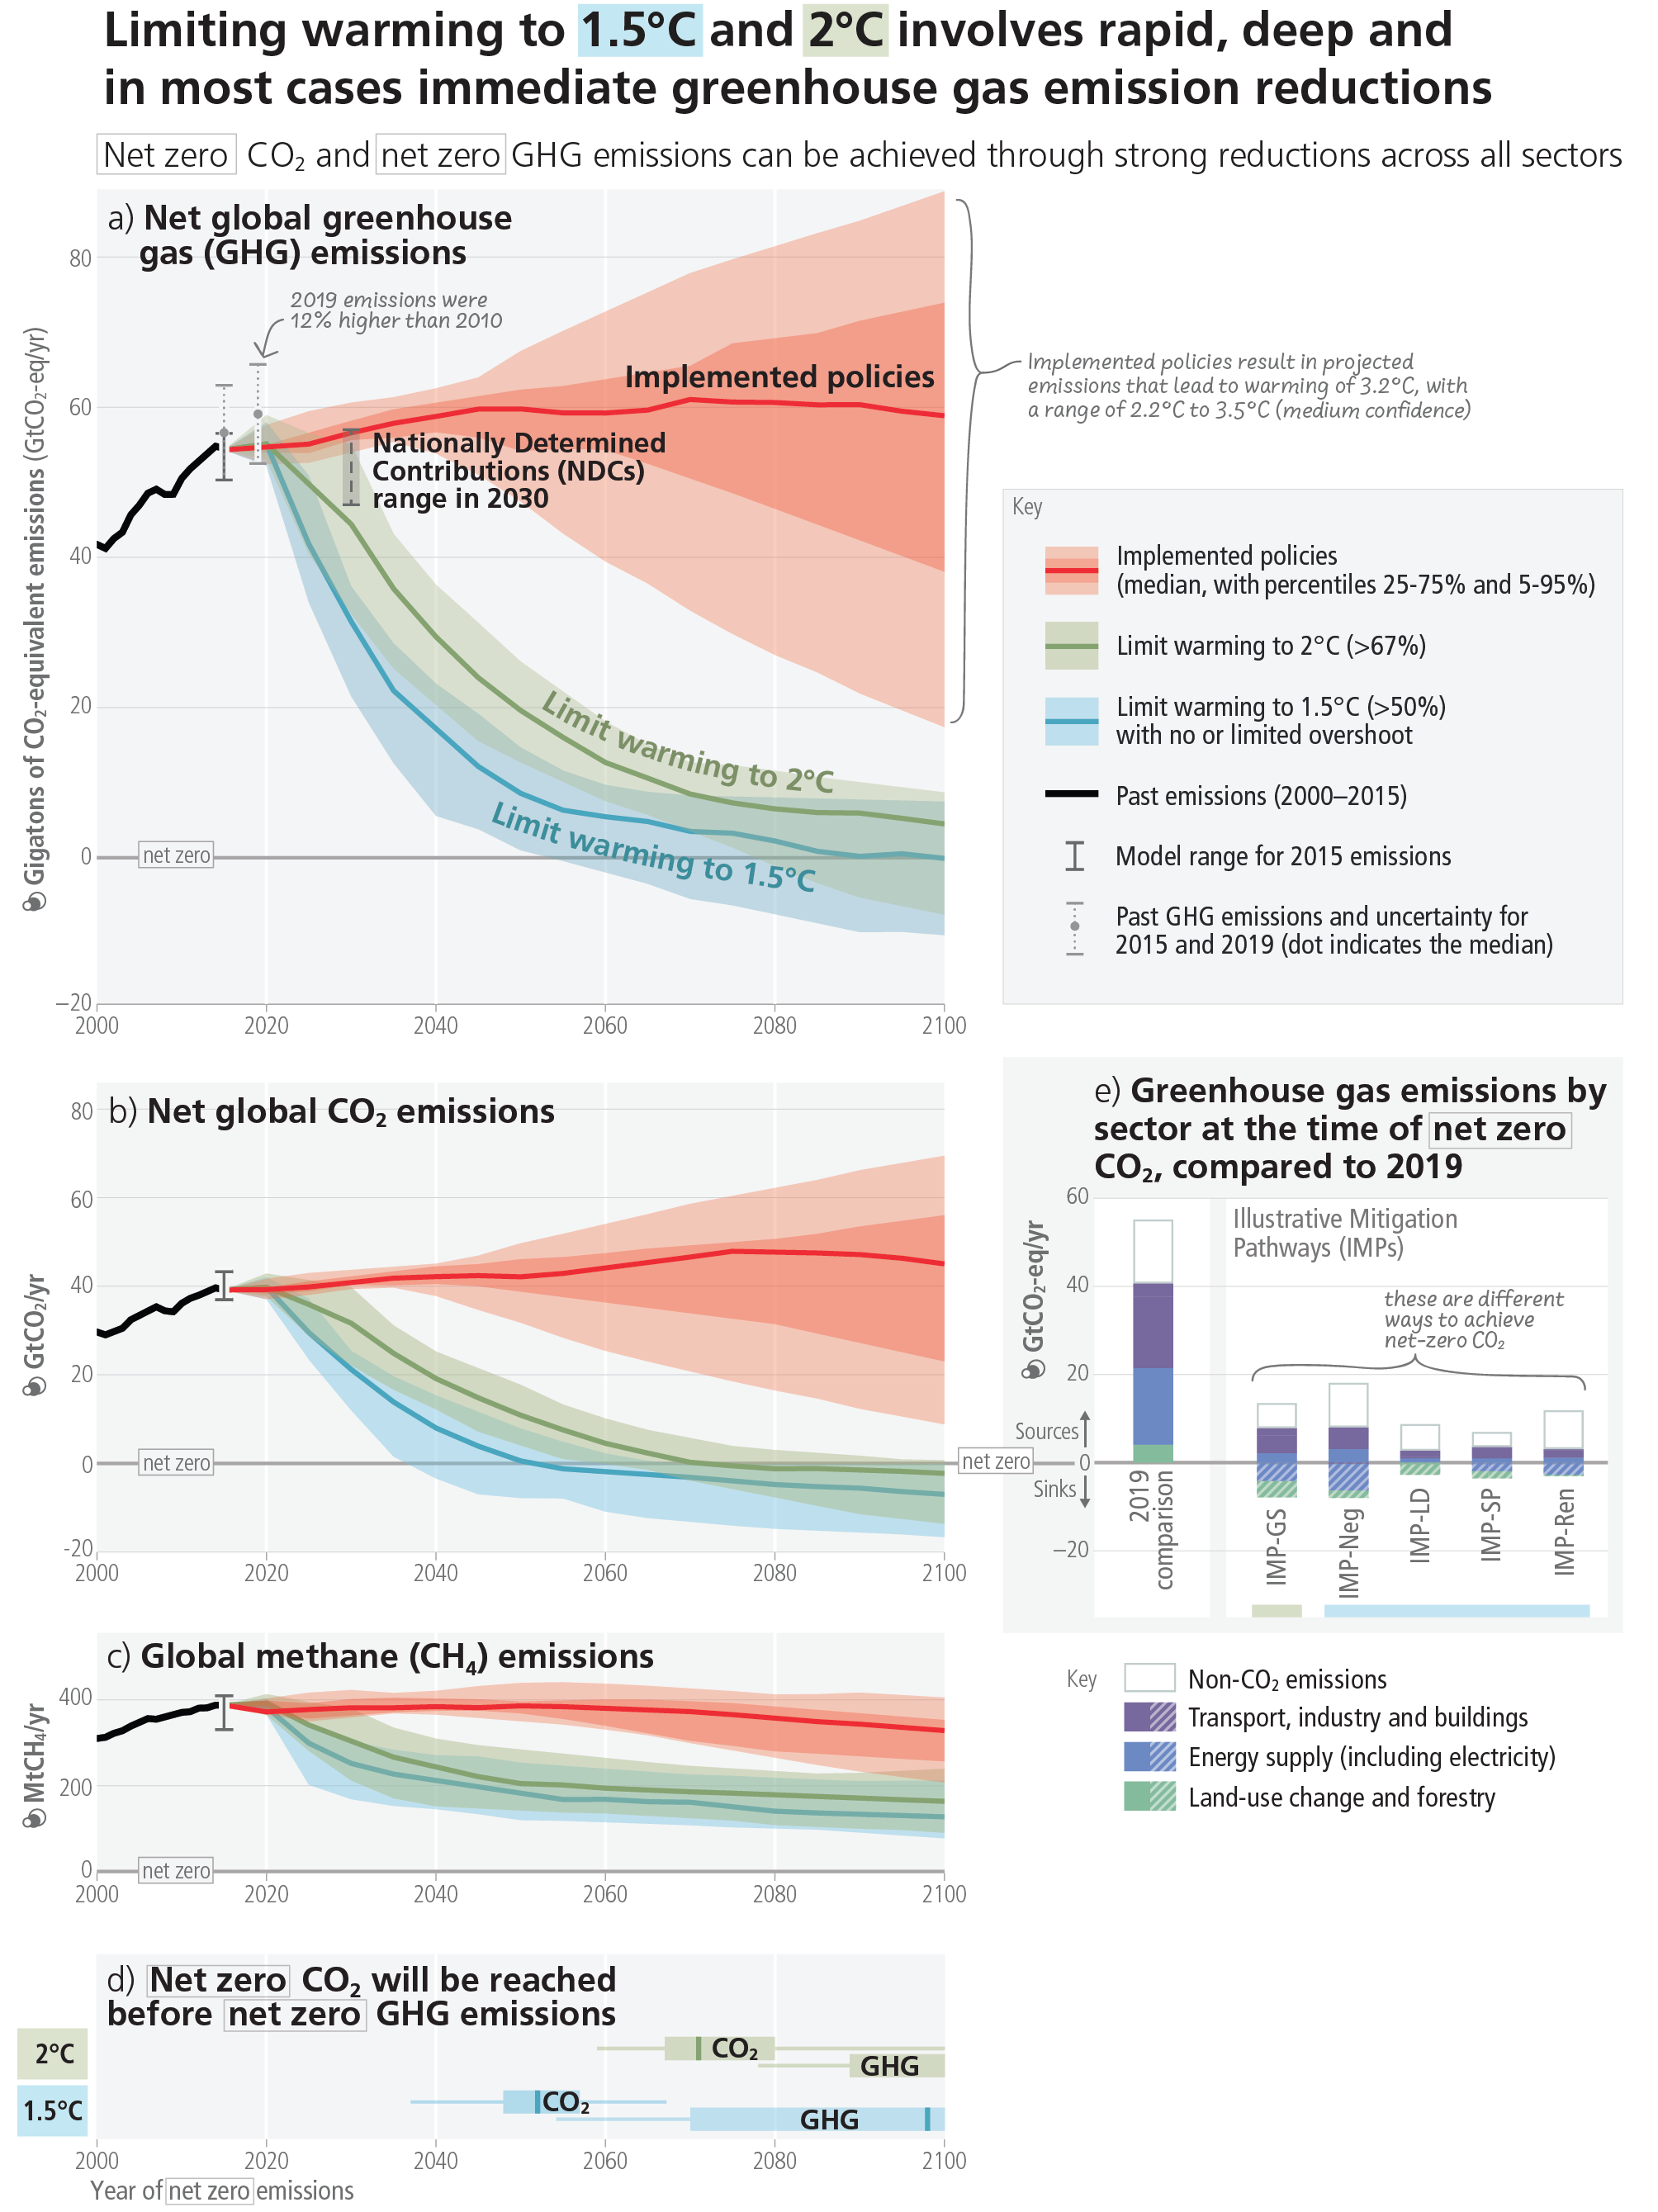
Figure SPM.5: Global emissions pathways consistent with implemented policies and mitigation strategies. Panel (a), (b) and (c) show the development of global GHG, CO2 and methane emissions in modelled pathways, while panel (d) shows the associated timing of when GHG and CO2 emissions reach net zero. Coloured ranges denote the 5th to 95th percentile across the global modelled pathways falling within a given category as described in Box SPM.1. The red ranges depict emissions pathways assuming policies that were implemented by the end of 2020. Ranges of modelled pathways that limit warming to 1.5°C (>50%) with no or limited overshoot are shown in light blue (category C1) and pathways that limit warming to 2°C (>67%) are shown in green (category C3). Global emission pathways that would limit warming to 1.5°C (>50%) with no or limited overshoot and also reach net zero GHG in the second half of the century do so between 2070-2075. Panel (e) shows the sectoral contributions of CO2 and non-CO2 emissions sources and sinks at the time when net zero CO2 emissions are reached in illustrative mitigation pathways (IMPs) consistent with limiting warming to 1.5°C with a high reliance on net negative emissions (IMP-Neg) (“high overshoot”), high resource efficiency (IMP-LD), a focus on sustainable development (IMP-SP), renewables (IMP-Ren) and limiting warming to 2°C with less rapid mitigation initially followed by a gradual strengthening (IMP-GS). Positive and negative emissions for different IMPs are compared to GHG emissions from the year 2019. Energy supply (including electricity) includes bioenergy with carbon dioxide capture and storage and direct air carbon dioxide capture and storage. CO2 emissions from land-use change and forestry can only be shown as a net number as many models do not report emissions and sinks of this category separately. {Figure 3.6, 4.1} (Box SPM.1)
