Figure 4.3
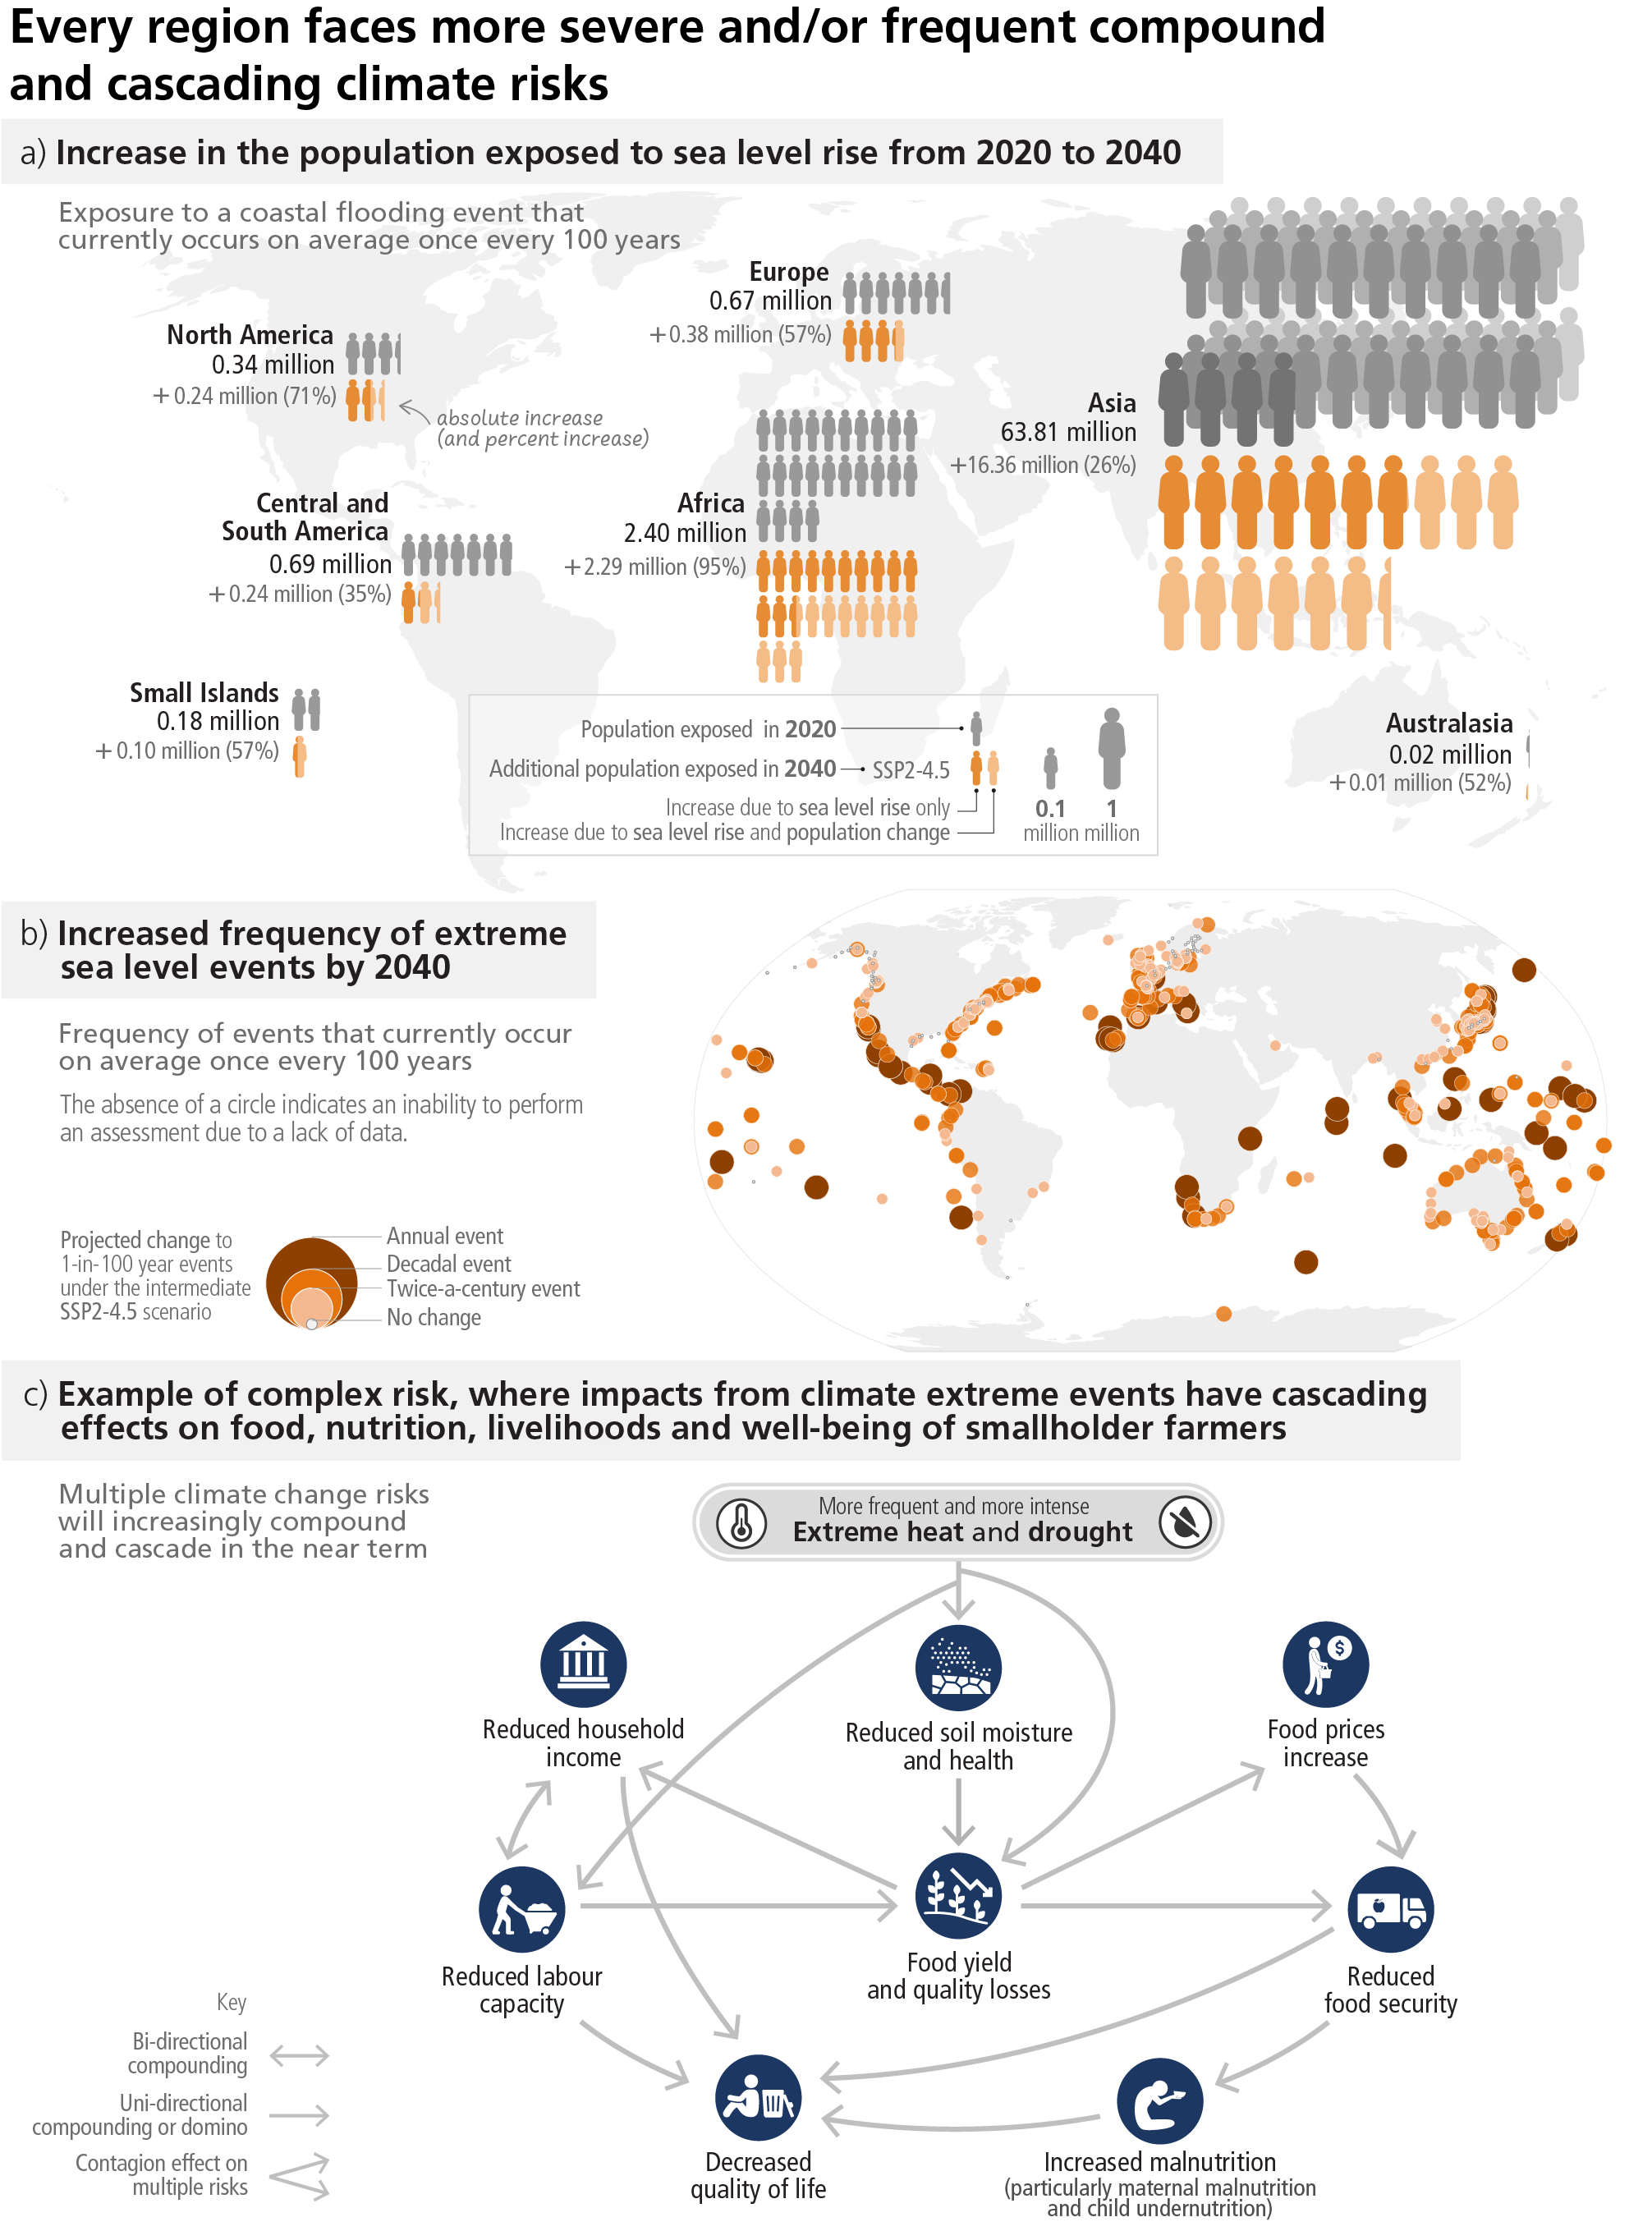
Figure caption
Figure 4.3: Every region faces more severe or frequent compound and/or cascading climate risks in the near term. Changes in risk result from changes in the degree of the hazard, the population exposed, and the degree of vulnerability of people, assets, or ecosystems. Panel (a) Coastal flooding events affect many of the highly populated regions of the world where large percentages of the population are exposed. The panel shows near-term projected increase of population exposed to 100-year flooding events depicted as the increase from the year 2020 to 2040 (due to sea level rise and population change), based on the intermediate GHG emissions scenario (SSP2-4.5) and current adaptation measures. Outmigration from coastal areas due to future sea level rise is not considered in the scenario. Panel (b) projected median probability in the year 2040 for extreme water levels resulting from a combination of mean sea level rise, tides and storm surges, which have a historical 1% average annual probability. A peak-over-threshold (99.7%) method was applied to the historical tide gauge observations available in the Global Extreme Sea Level Analysis version 2 database, which is the same information as WGI Figure 9.32, except here the panel uses relative sea level projections under SSP2-4.5 for the year 2040 instead of 2050 The absence of a circle indicates an inability to perform an assessment due to a lack of data, but does not indicate absence of increasing frequencies. Panel (c) Climate hazards can initiate risk cascades that affect multiple sectors and propagate across regions following complex natural and societal connections. This example of a compound heat wave and a drought event striking an agricultural region shows how multiple risks are interconnected and lead to cascading biophysical, economic, and societal impacts even in distant regions, with vulnerable groups such as smallholder farmers, children and pregnant women particularly impacted. {WGI Figure 9.32; WGII SPM B4.3, WGII SPM B1.3, WGII SPM B.5.1, WGII TS Figure TS.9, WGII TS Figure TS.10 (c), WGII Fig 5.2, WGII TS.B.2.3, WGII TS.B.2.3, WGII TS.B.3.3, WGII 9.11.1.2}