Figure 4.1
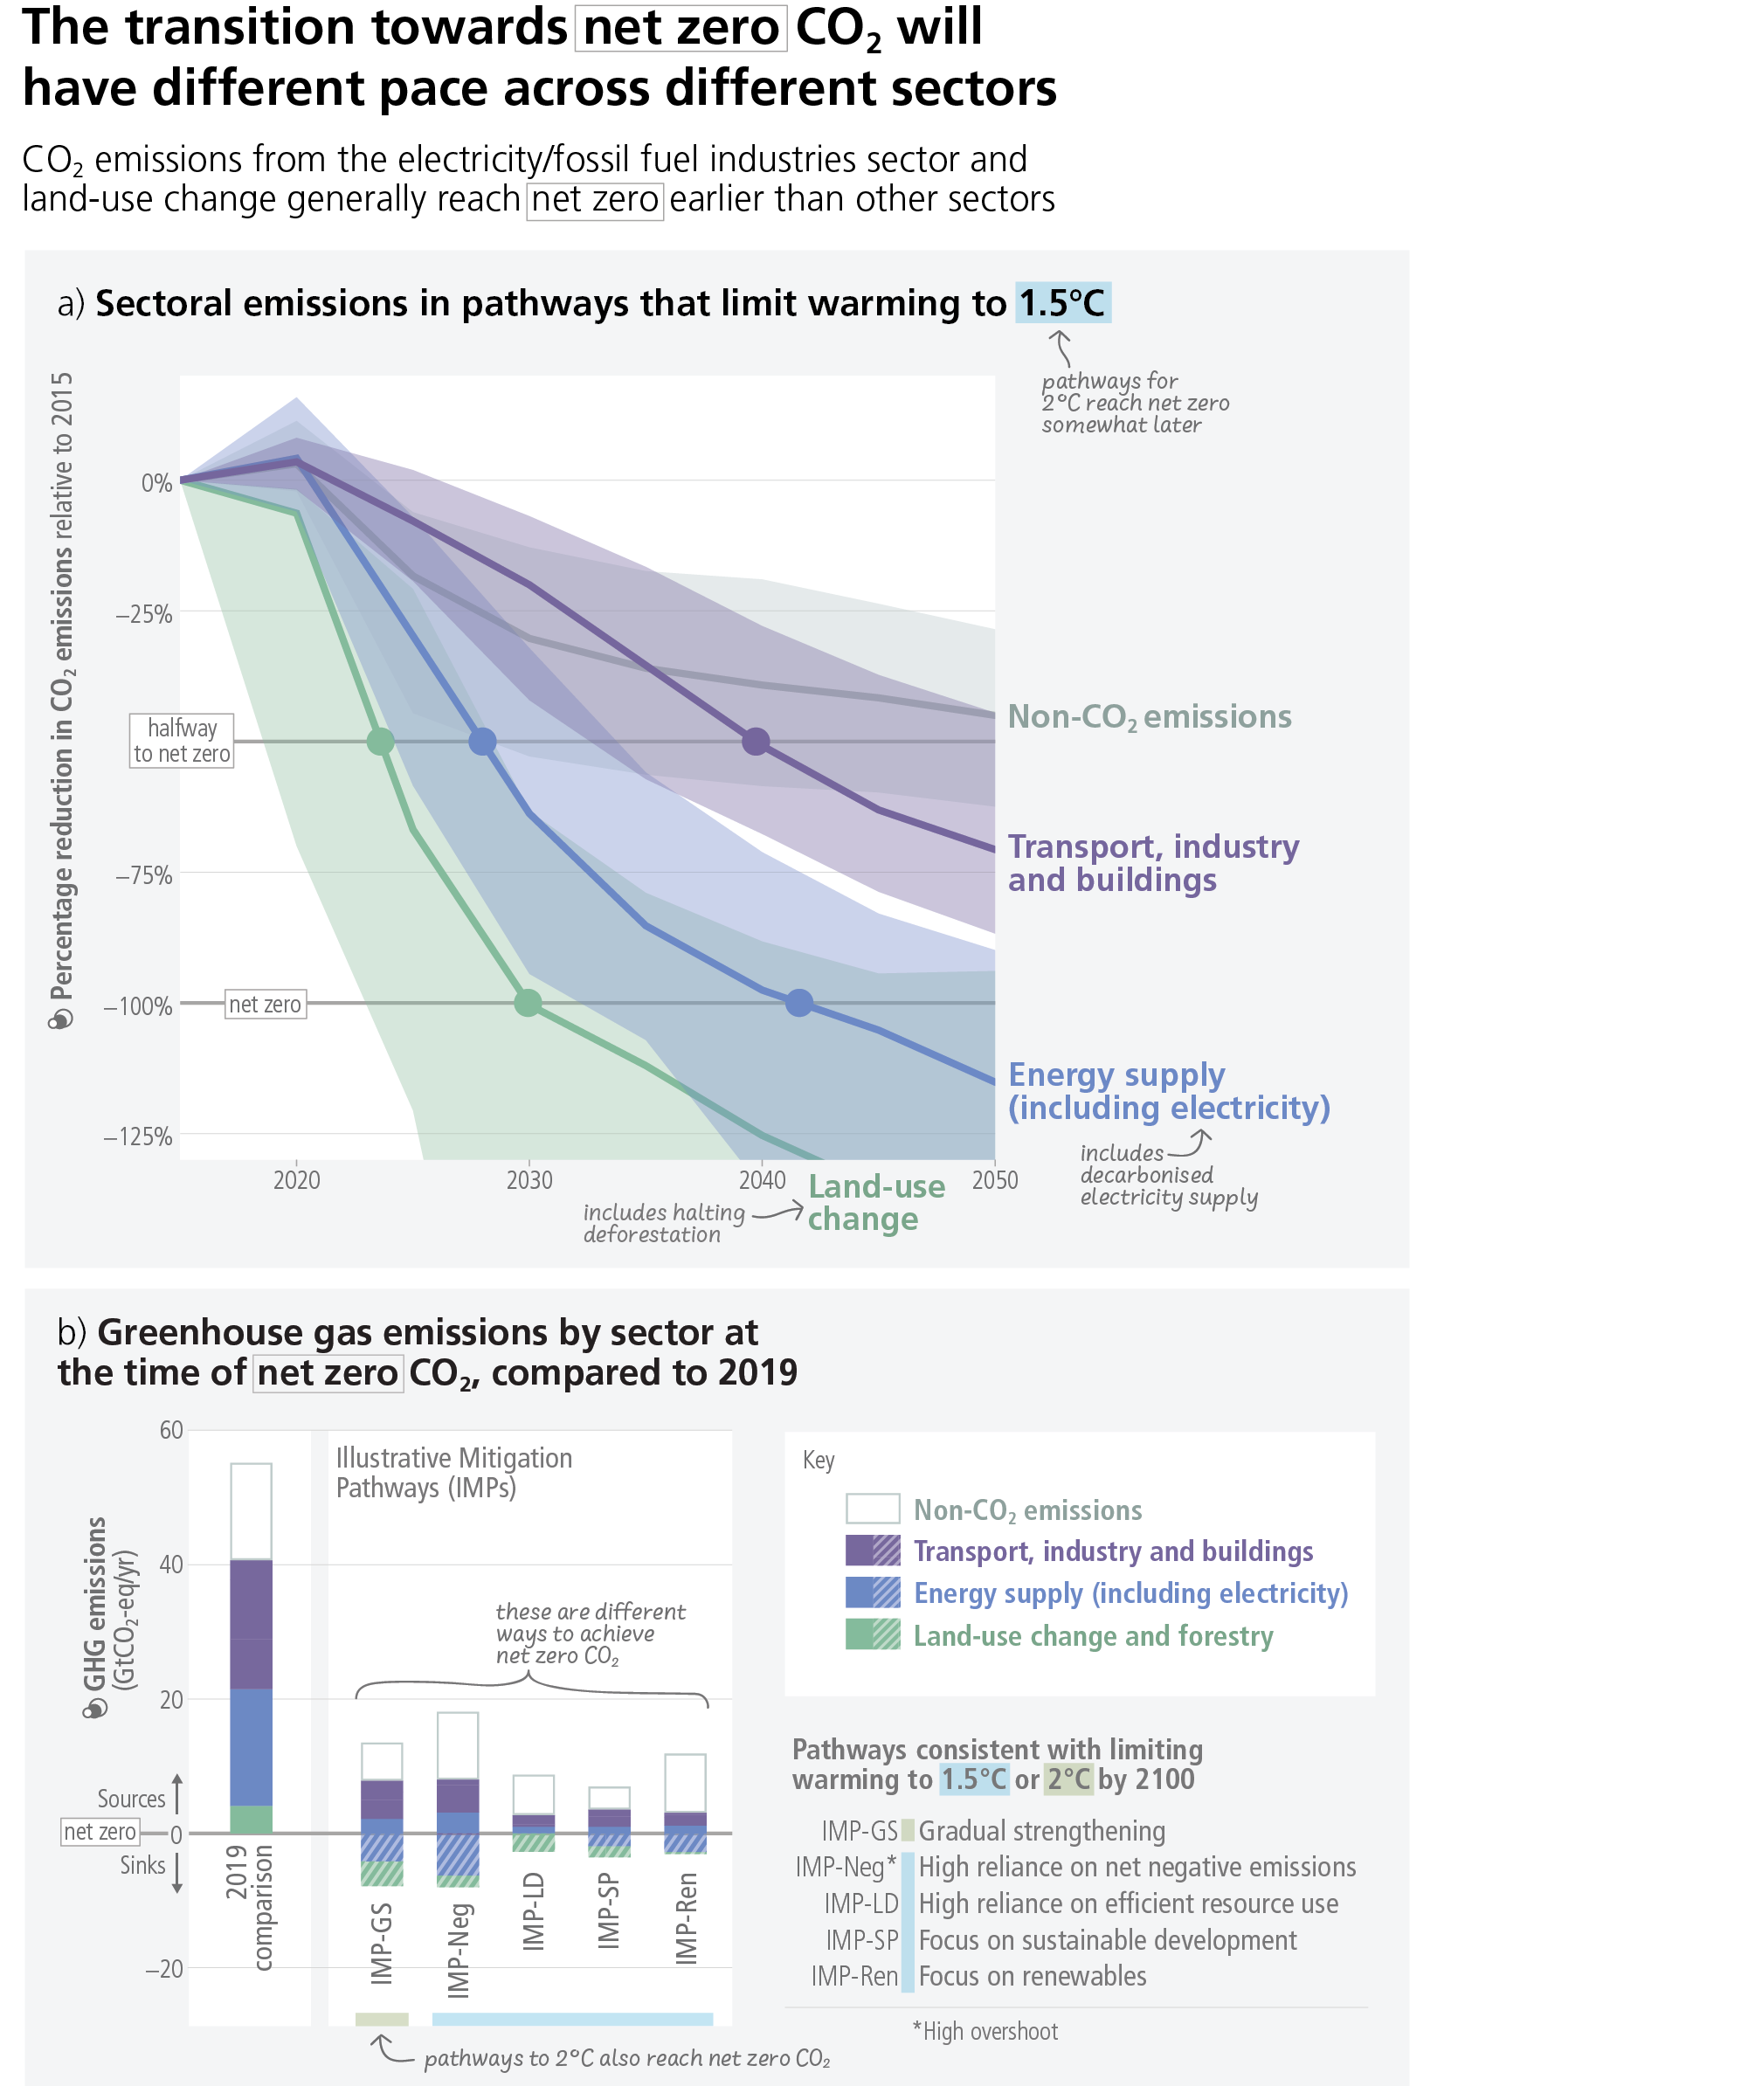
Figure caption
Figure 4.1: Sectoral emissions in pathways that limit warming to 1.5°C. Panel (a) shows sectoral CO2 and non-CO2 emissions in global modelled pathways that limit warming to 1.5°C (>50%) with no or limited overshoot. The horizontal lines illustrate halving 2015 emissions (base year of the pathways) (dashed) and reaching net-zero emissions (solid line). The range shows the 5–95th percentile of the emissions across the pathways. The timing strongly differs by sector, with the CO2 emissions from the electricity/fossil fuel industries sector and land-use change generally reaching net zero earlier. Non-CO2 emissions from agriculture are also substantially reduced compared to pathways without climate policy but do not typically reach zero. Panel (b) Although all pathways include strongly reduced emissions, there are different pathways as indicated by the illustrative mitigation pathways used in IPCC WGIII. The pathways emphasise routes consistent with limiting warming to 1.5°C with a high reliance on net negative emissions (IMP-Neg), high resource efficiency (IMP-LD), a focus on sustainable development (IMP-SP) or renewables (IMP-Ren) and consistent with 2°C based on a less rapid introduction of mitigation measures followed by a subsequent gradual strengthening (IMP-GS). Positive (solid filled bars) and negative emissions (hatched bars) for different illustrative mitigation pathways are compared to GHG emissions from the year 2019. The category “energy supply (including electricity)” includes bioenergy with carbon capture and storage and direct air carbon capture and storage. {WGIII Box TS.5, 3.3, 3.4, 6.6, 10.3, 11.3} (Cross-Section Box 2)