Figure 3.6
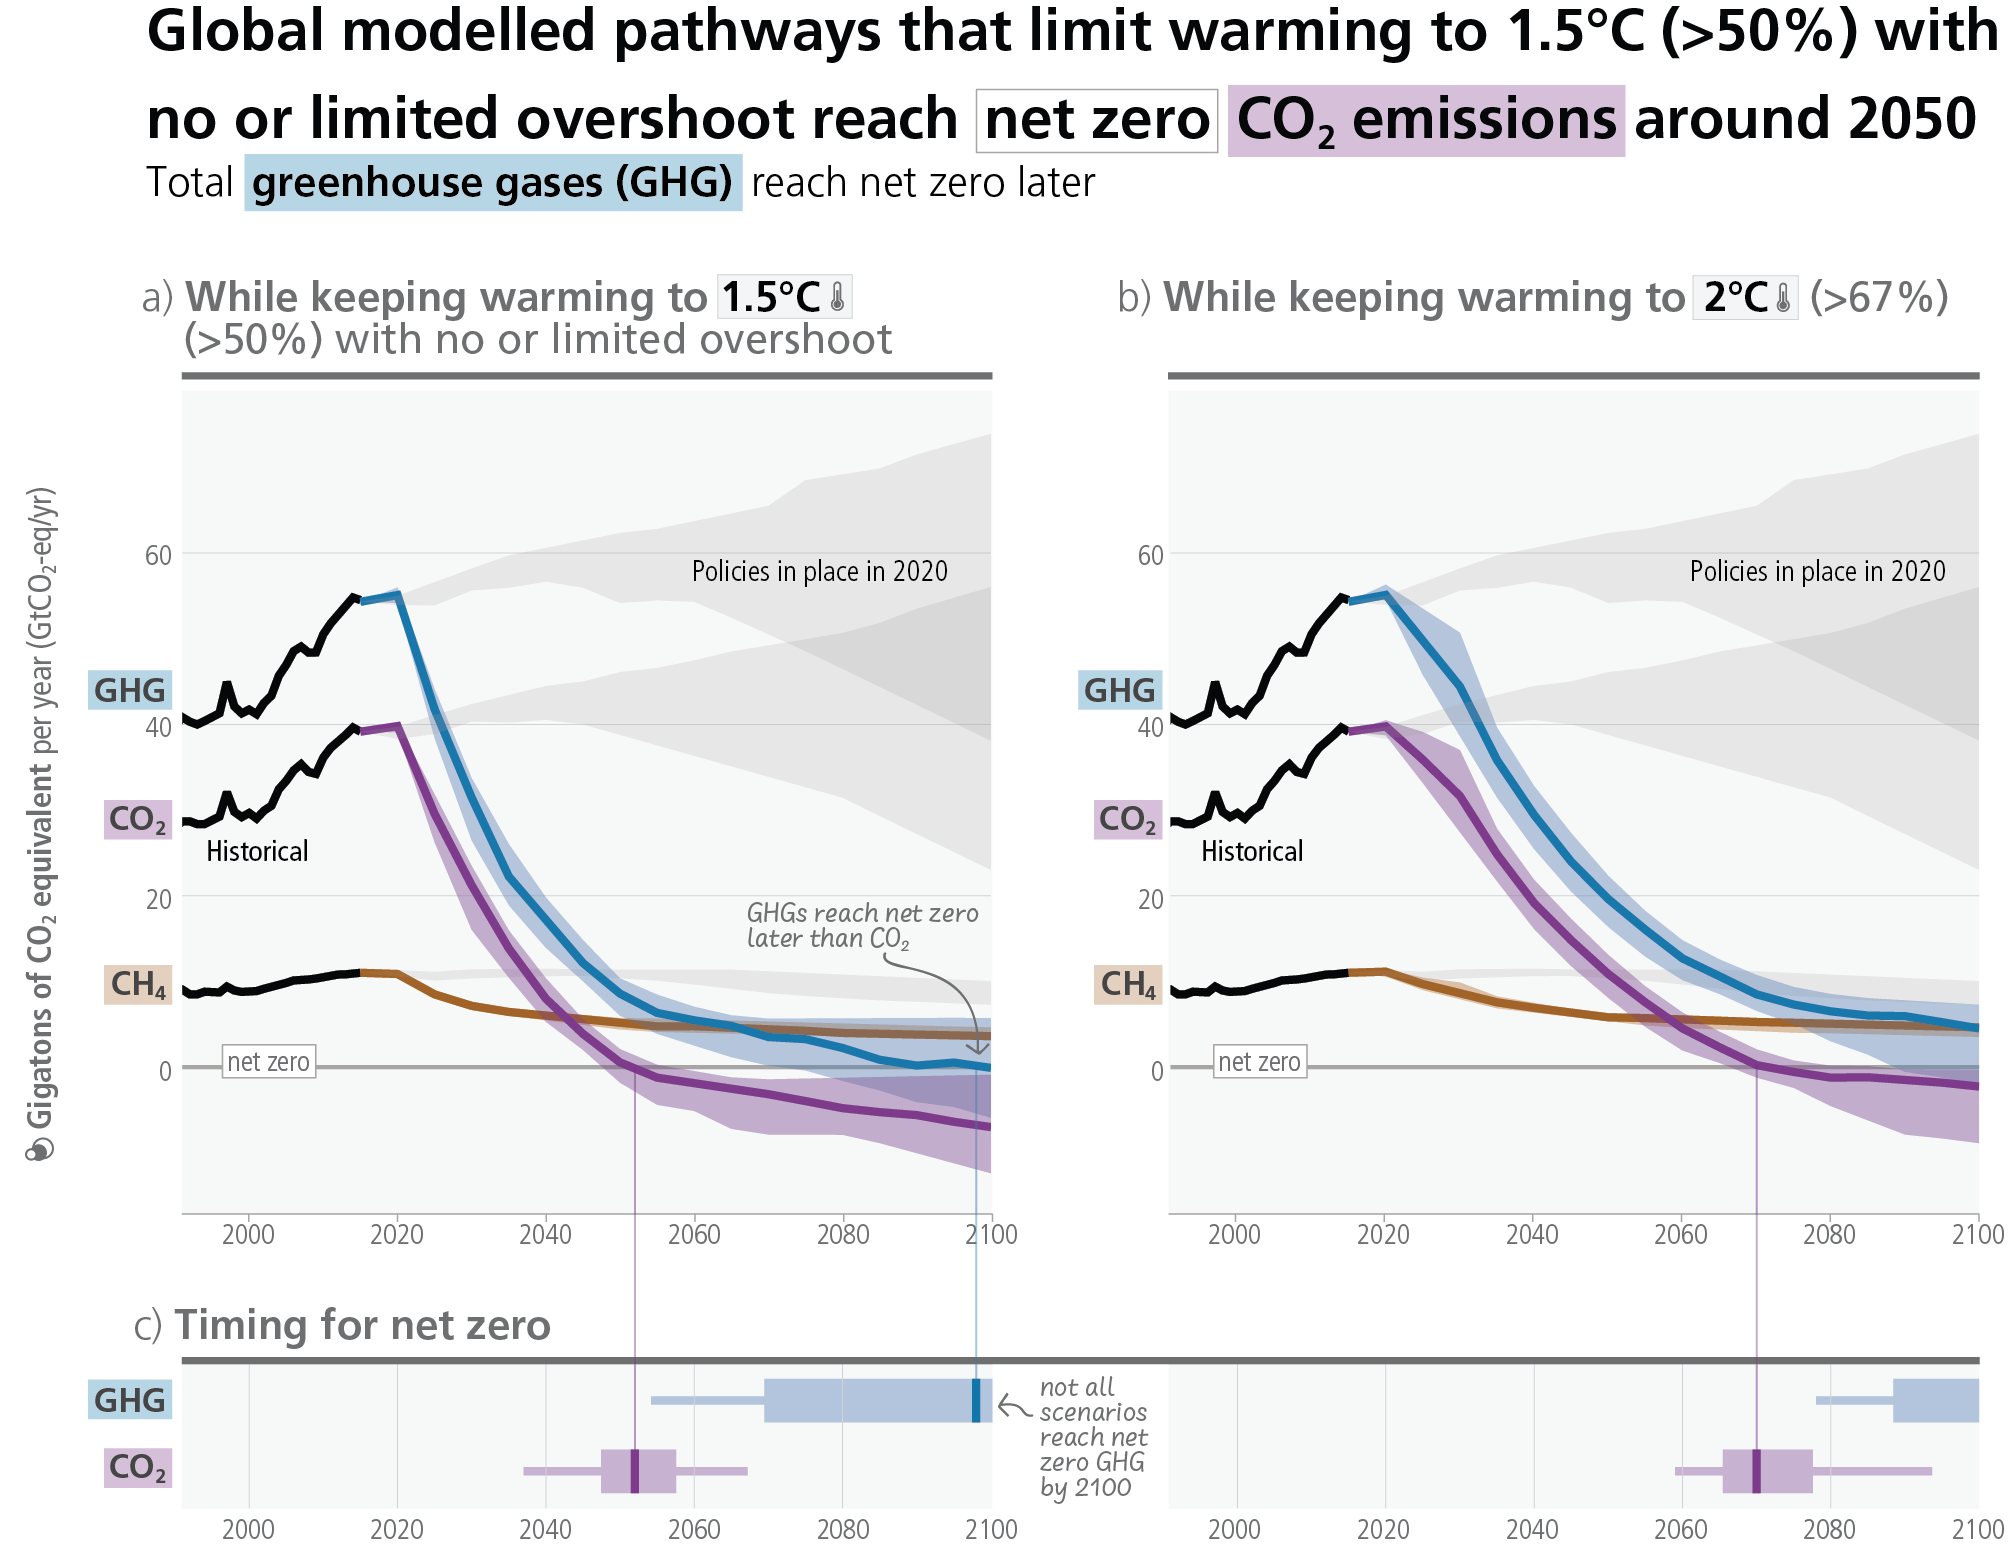
Figure caption
Figure 3.6: Total GHG, CO2 and CH4 emissions and timing of reaching net-zero in different mitigation pathways. Top row: GHG, CO2 and CH4 emissions over time (in GtCO2eq) with historical emissions, projected emissions in line with policies implemented until the end of 2020 (grey), and pathways consistent with temperature goals in colour (blue, purple, and brown, respectively); Panel (a) (left) shows pathways that limit warming to 1.5°C (>50%) with no or limited overshoot (C1) and Panel (b) (right) shows pathways that limit warming to 2°C (>66%) (C3). Bottom row: Panel (c) shows median (vertical line), likely (bar) and very likely (thin lines) timing of reaching net-zero GHG and CO2 emissions for global modelled pathways that limit warming to 1.5°C (>50%) with no or limited overshoot (C1) (left) or 2°C (>67%) (C3) (right). {WGIII Figure SPM.5}