Cross-Section Box.2, Figure 1
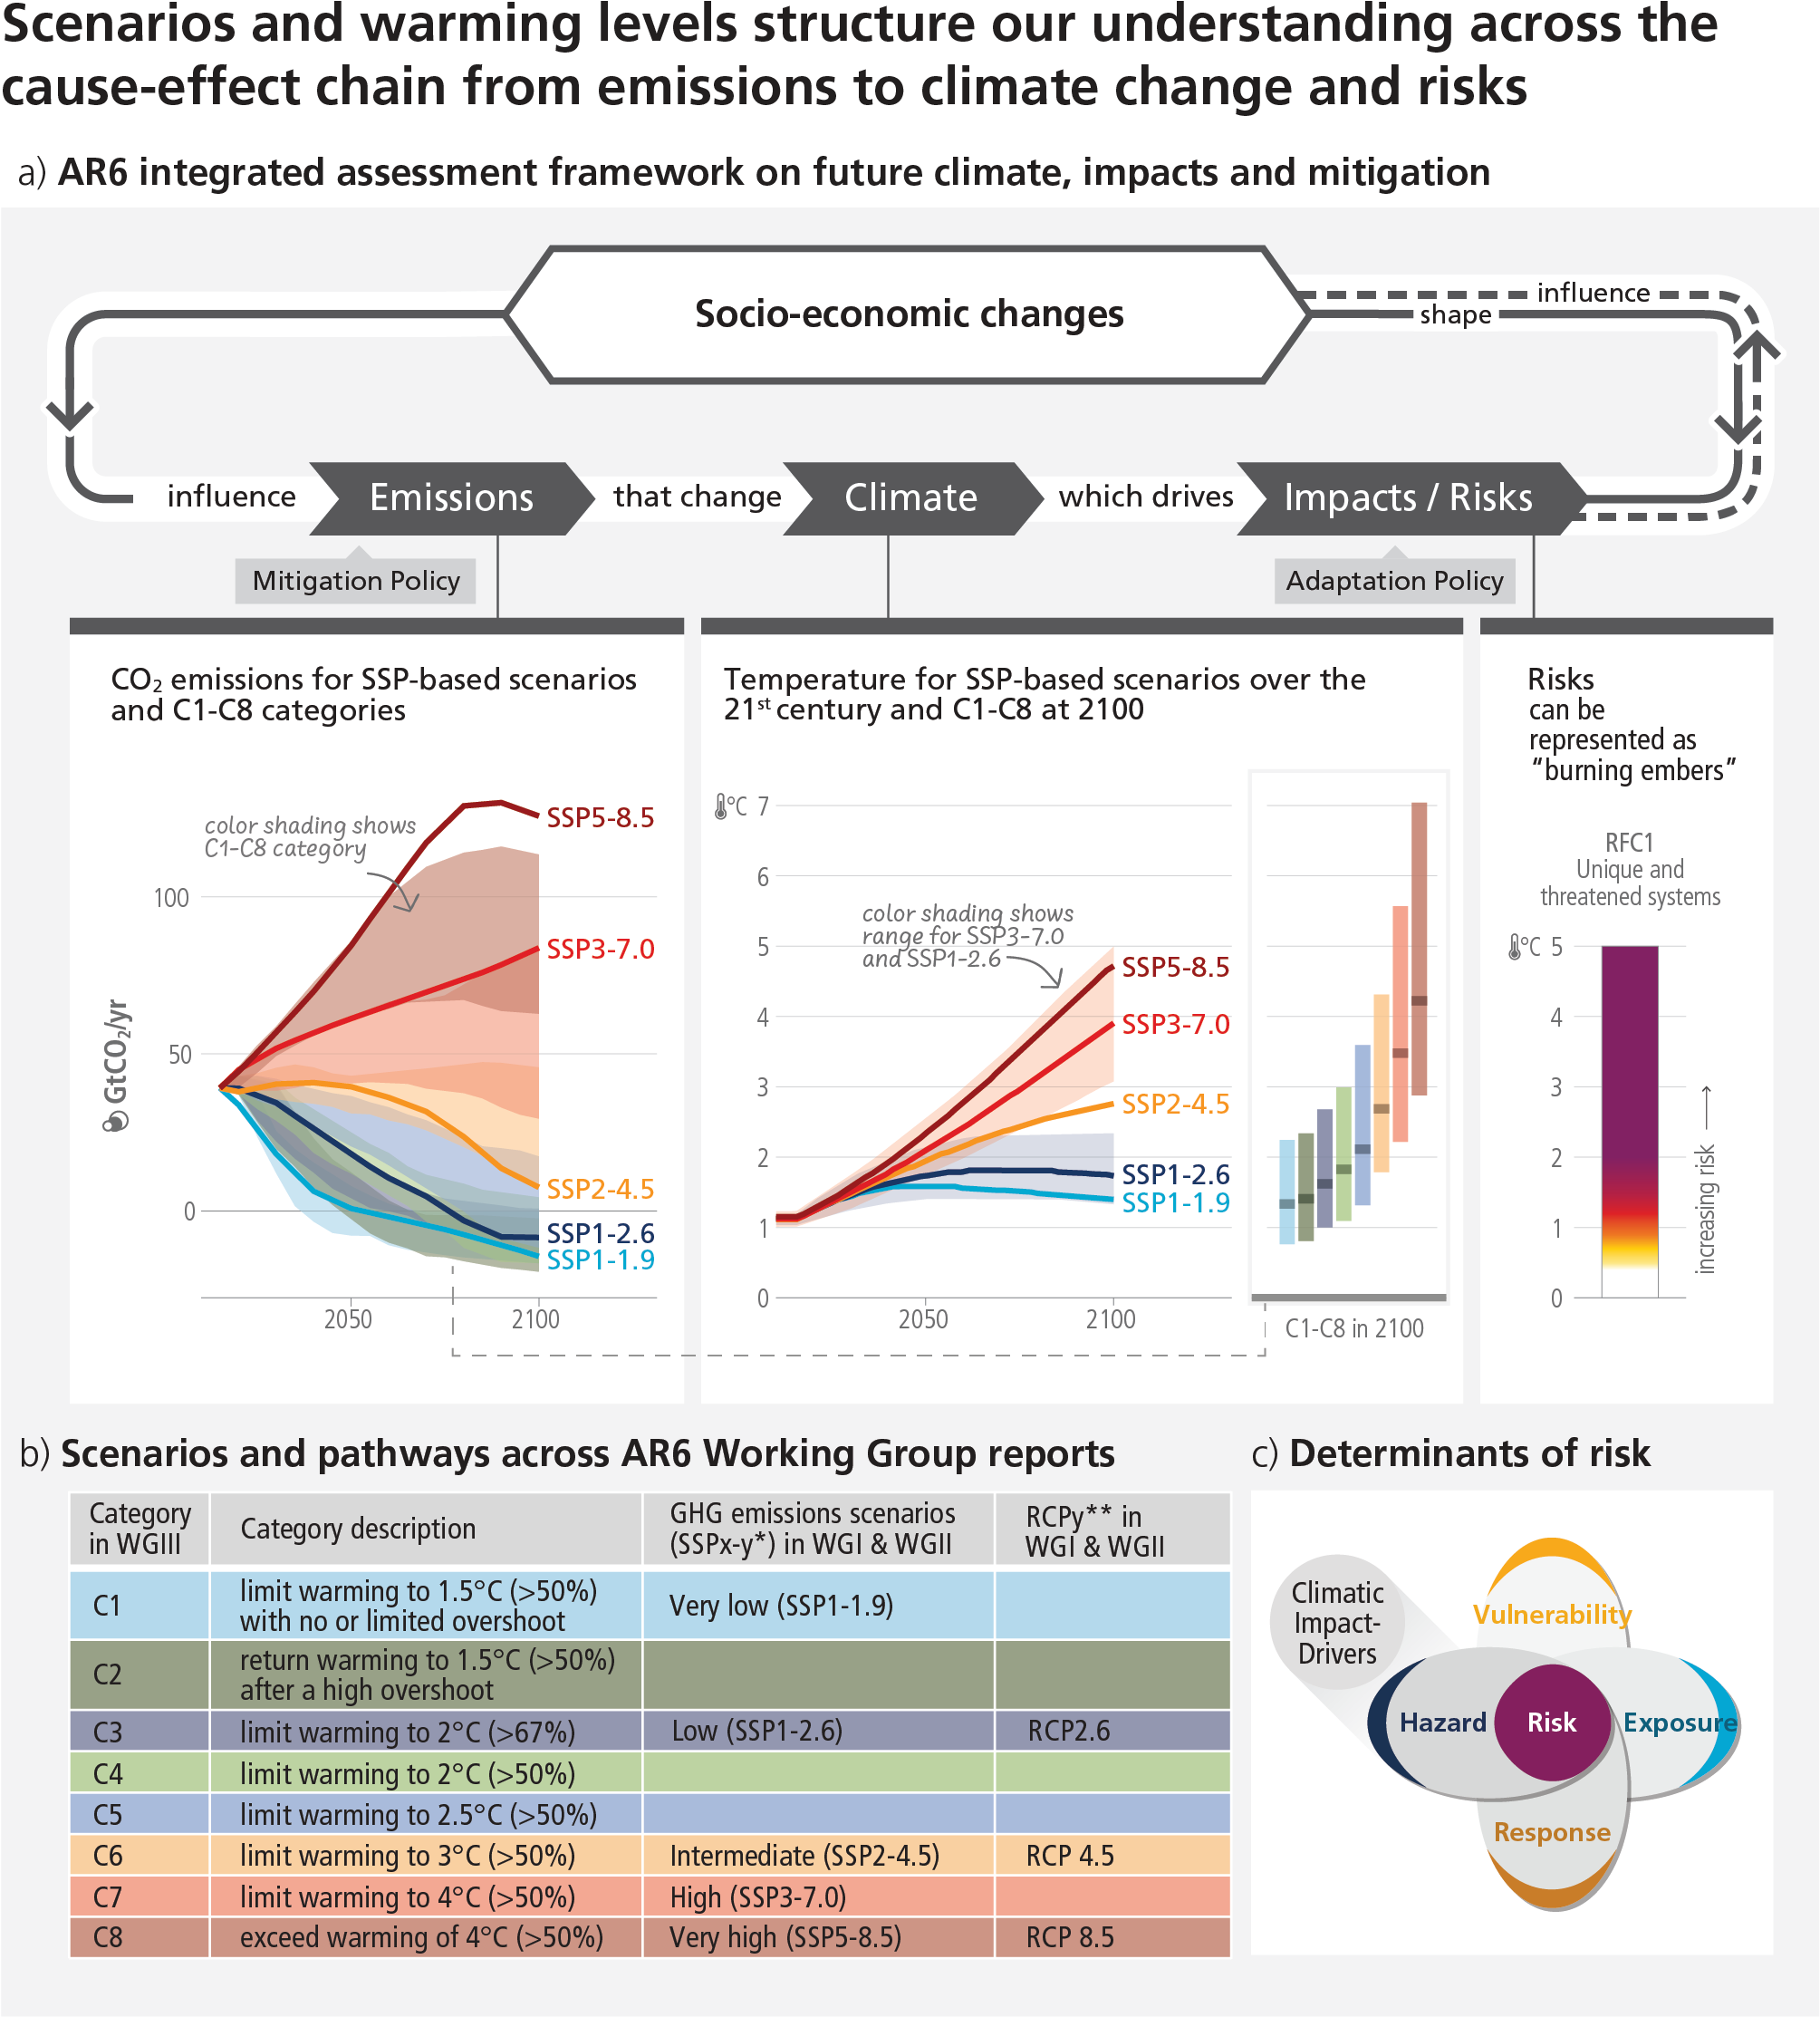
Figure caption
Cross-Section Box.2, Figure 1: Schematic of the AR6 framework for assessing future greenhouse gas emissions, climate change, risks, impacts and mitigation. Panel (a) The integrated framework encompasses socio-economic development and policy, emissions pathways and global surface temperature responses to the five scenarios considered by WGI (SSP1-1.9, SSP1-2.6, SSP2-4.5, SSP3-7.0, and SSP5-8.5) and eight global mean temperature change categorisations (C1–C8) assessed by WGIII, and the WGII risk assessment. The dashed arrow indicates that the influence from impacts/risks to socio-economic changes is not yet considered in the scenarios assessed in the AR6. Emissions include GHGs, aerosols, and ozone precursors. CO2 emissions are shown as an example on the left. The assessed global surface temperature changes across the 21st century relative to 1850–1900 for the five GHG emissions scenarios are shown as an example in the centre. Very likely ranges are shown for SSP1-2.6 and SSP3-7.0. Projected temperature outcomes at 2100 relative to 1850–1900 are shown for C1 to C8 categories with median (line) and the combined very likely range across scenarios (bar). On the right, future risks due to increasing warming are represented by an example ‘burning ember’ figure (see 3.1.2 for the definition of RFC1). Panel (b) Description and relationship of scenarios considered across AR6 Working Group reports. Panel (c) Illustration of risk arising from the interaction of hazard (driven by changes in climatic impact-drivers) with vulnerability, exposure and response to climate change. {WGI TS1.4, Figure 4.11; WGII Figure 1.5, WGII Figure 14.8; WGIII Table SPM.2, Figure 3.11}
* The terminology SSPx-y is used, where ‘SSPx’ refers to the Shared Socio-economic Pathway or ‘SSP’ describing the socio-economic trends underlying the scenario, and ‘y’ refers to the approximate level of radiative forcing (in watts per square metre, or W m–2) resulting from the scenario in the year 2100.
** The AR5 scenarios (RCPy), which partly inform the AR6 WGI and WGII assessments, are indexed to a similar set of approximate 2100 radiative forcing levels (in Wm-2). The SSP scenarios cover a broader range of GHG and air pollutant futures than the RCPs. They are similar but not identical, with differences in concentration trajectories for different GHGs. The overall radiative forcing tends to be higher for the SSPs compared to the RCPs with the same label (medium confidence). {WGI TS.1.3.1}
*** Limited overshoot refers to exceeding 1.5°C global warming by up to about 0.1°C, high overshoot by 0.1°C-0.3°C, in both cases for up to several decades.