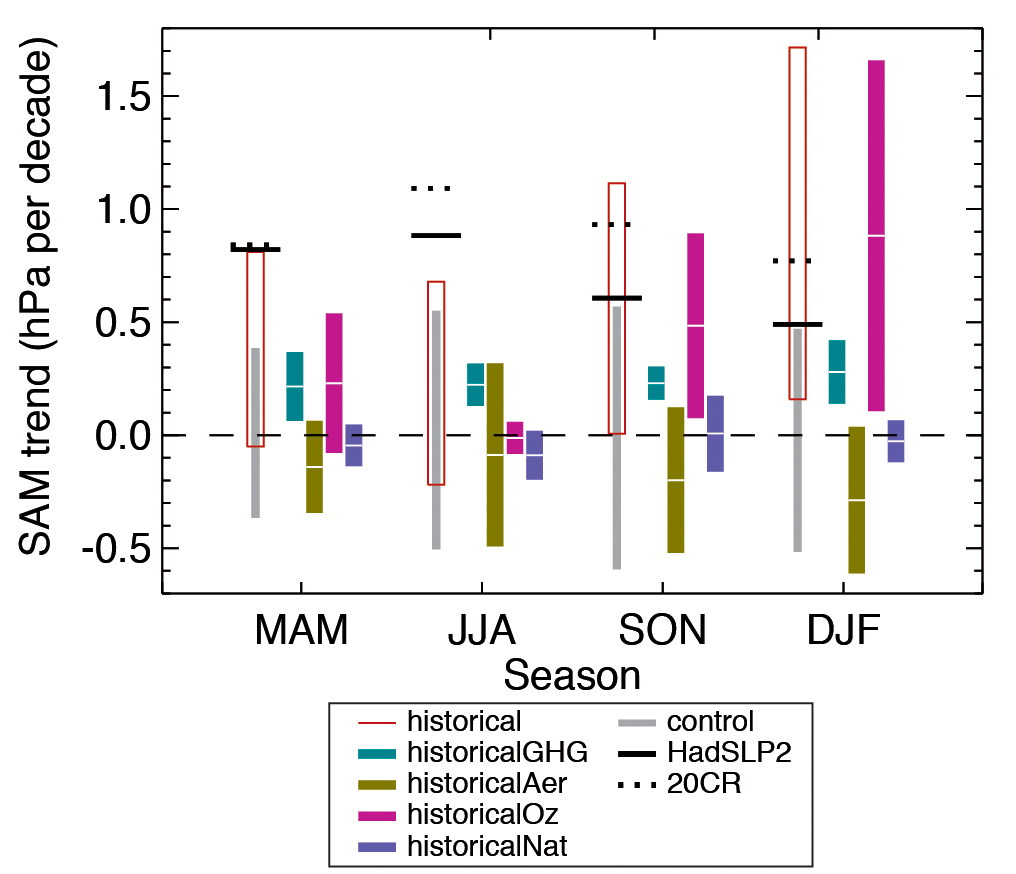
Figure TS.11
Simulated and observed 1951–2011 trends in the Southern Annular Mode (SAM) index by season. The SAM index is a difference between zonal mean sea level pressure (SLP) at 40°S and 65°S. The SAM index is defined without normaliza- tion, so that the magnitudes of simulated and observed trends can be compared. Black lines show observed trends from the Hadley Centre Sea Level Pressure 2r (HadSLP2r) data set (solid), and the 20th Century Reanalysis (dotted). Grey bars show 5th to 95th percentile ranges of control trends, and red boxes show the 5th to 95th percentile range of trends in historical simulations including anthropogenic and natural forcings. Coloured bars show ensemble mean trends and their associated 5 to 95% confidence ranges simulated in response to well-mixed greenhouse gas (light green), aerosol (dark green), ozone (magenta) and natural forcing changes (blue) in CMIP5 individual-forcing simulations. {Figure 10.13b}
You may freely download and copy the material contained on this website for your personal, non-commercial use, without any right to resell, redistribute, compile or create derivative works therefrom, subject to more specific restrictions that may apply to specific materials.