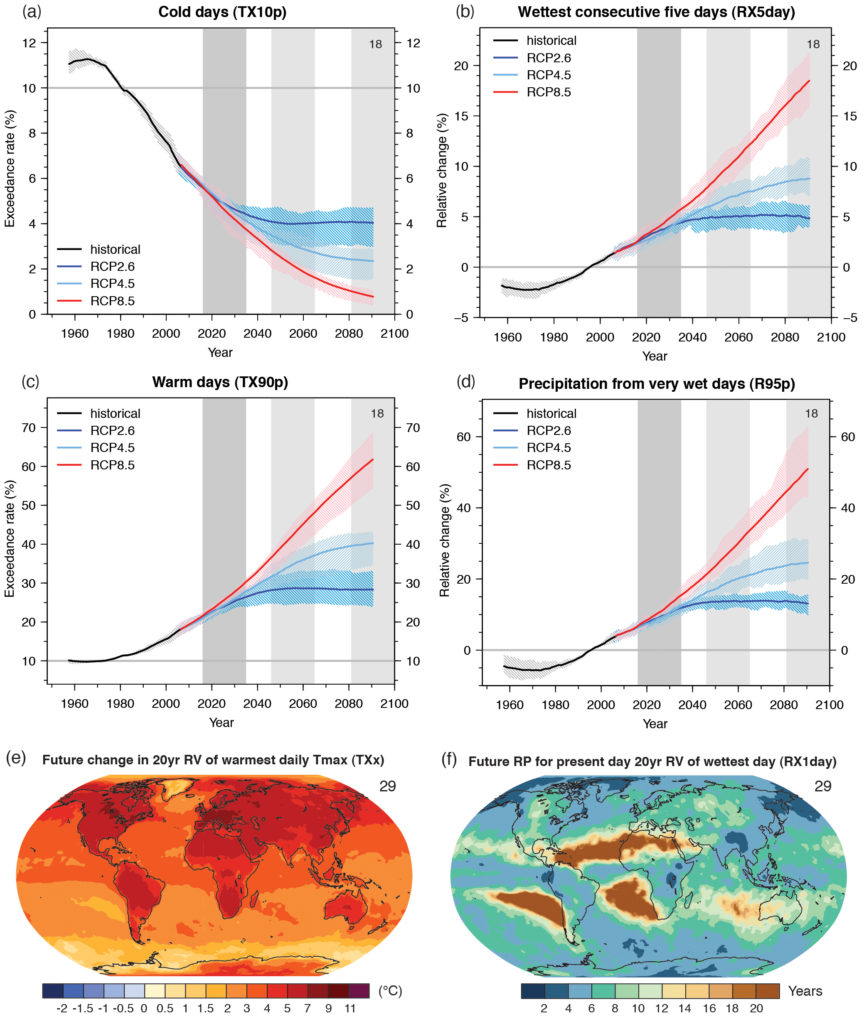
TFE.9, Figure 1
Global projections of the occurrence of (a) cold days (TX10p)- percentage of days annually with daily maximum surface air temperature (Tmax) below the 10th percentile of Tmax for 1961 to 1990, (b) wettest consecutive 5 days (RX5day) —percentage change relative to 1986–2005 in annual maximum consecutive 5-day precipitation totals, (c) warm days (TX90p)—percentage of days annually with daily maximum surface air temperature (Tmax) exceeding the 90th percentile of Tmax for 1961 to 1990 and (d) very wet day precipitation (R95p)—percentage change relative to 1986–2005 of annual precipitation from days >95th percentile. Results are shown from CMIP5 for the RCP2.6, RCP4.5 and RCP8.5 scenarios. Solid lines indicate the ensemble median and shading indicates the interquartile spread between individual projections (25th and 75th percentiles). Maps show (e) the change from 1986–2005 to 2081–2100 in 20-year return values (RV) of daily maximum temperatures, TXx, and (f) the 2081–2100 return period (RP) for rare daily precipitation values, RX1day, that have a 20-year return period during 1986–2005. Both maps are based on the CMIP5 RCP8.5 scenario. The number of models used to calculate the multi-model mean is indicated in each panel. See Box 2.4, Table 1 for index definitions. {Figures 11.17, 12.14, 12.26, 12.27}
You may freely download and copy the material contained on this website for your personal, non-commercial use, without any right to resell, redistribute, compile or create derivative works therefrom, subject to more specific restrictions that may apply to specific materials.