
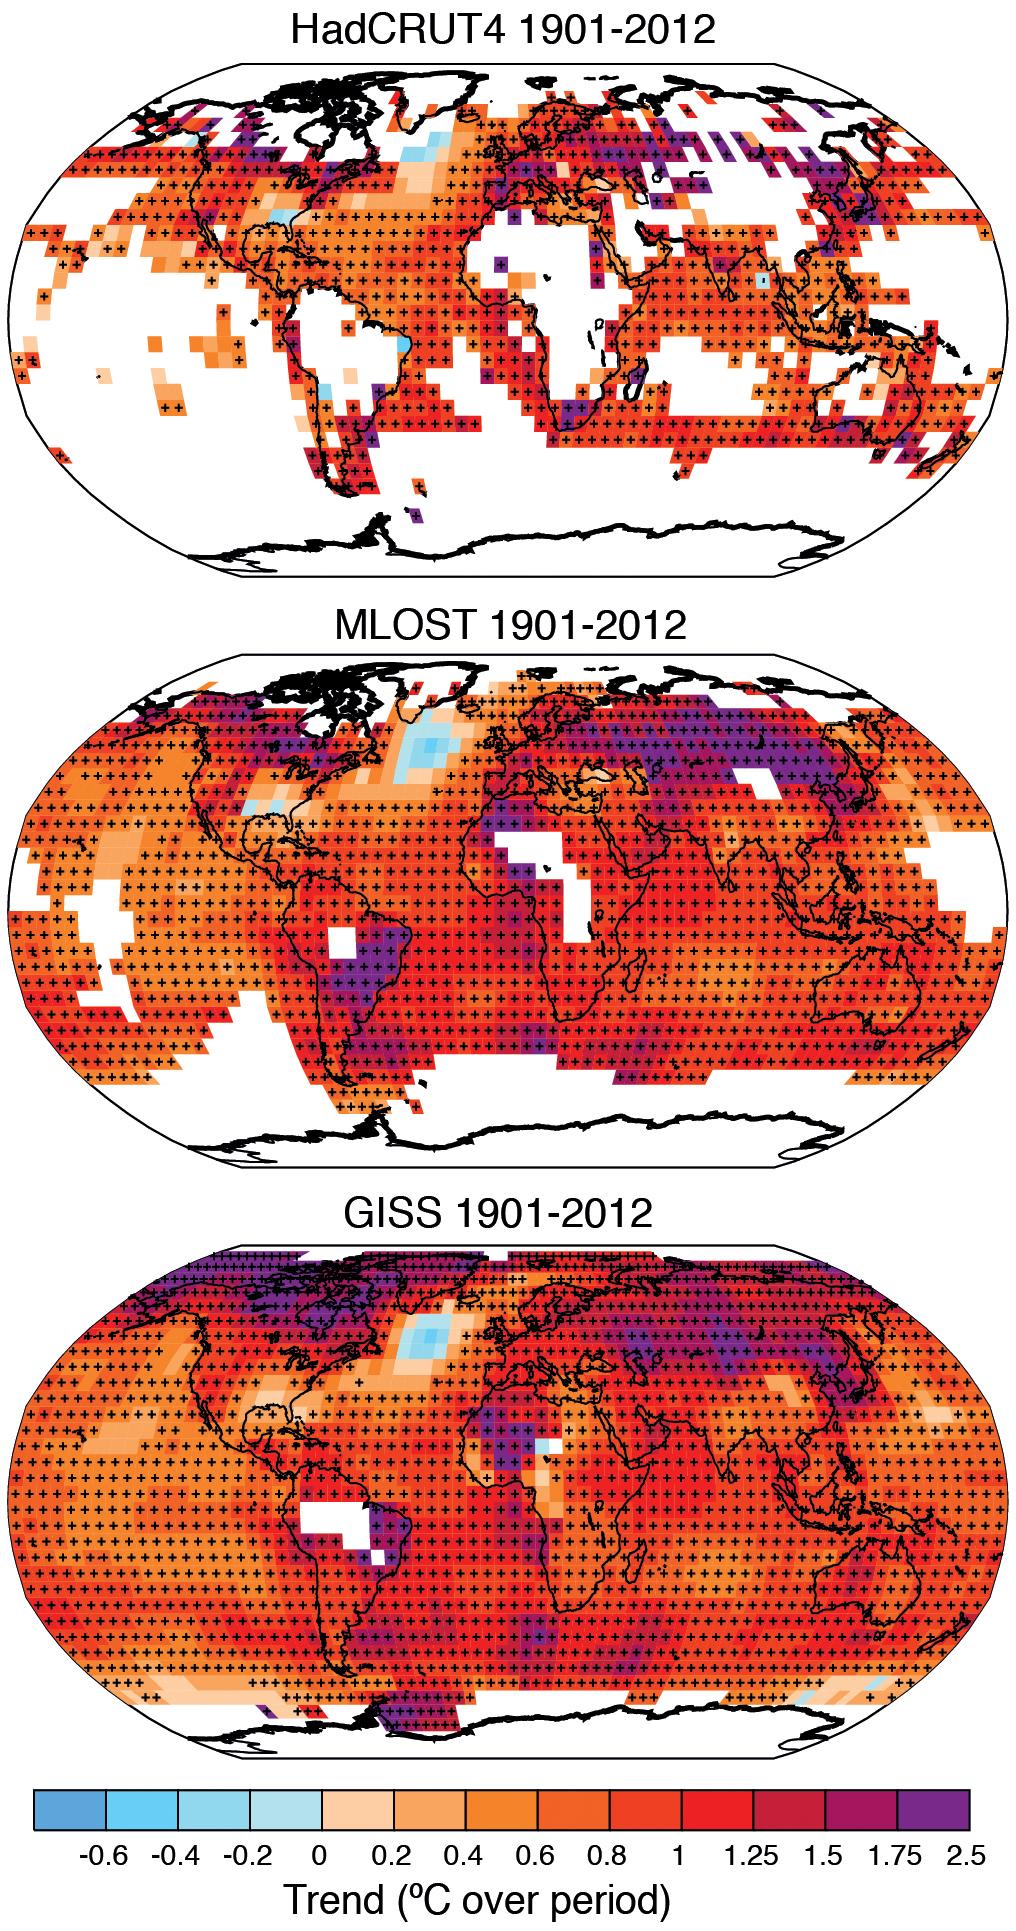
Figure TS.2
Change in surface temperature over 1901–2012 as determined by linear trend for three data sets. White areas indicate incomplete or missing data. Trends have been calculated only for those grid boxes with greater than 70% complete records and more than 20% data availability in the first and last 10% of the time period. Black plus signs (+) indicate grid boxes where trends are significant (i.e., a trend of zero lies out- side the 90% confidence interval). Differences in coverage primarily reflect the degree of interpolation to account for data void regions undertaken by the data set providers ranging from none beyond grid box averaging (Hadley Centre/Climatic Research Unit gridded surface temperature data set 4 (HadCRUT4)) to substantial (Goddard Institute for Space Studies Surface Temperature Analysis (GISTEMP)). Further detail regarding the related Figure SPM.1 is given in the TS Supplementary Material. {Figure 2.21}
You may freely download and copy the material contained on this website for your personal, non-commercial use, without any right to resell, redistribute, compile or create derivative works therefrom, subject to more specific restrictions that may apply to specific materials.