
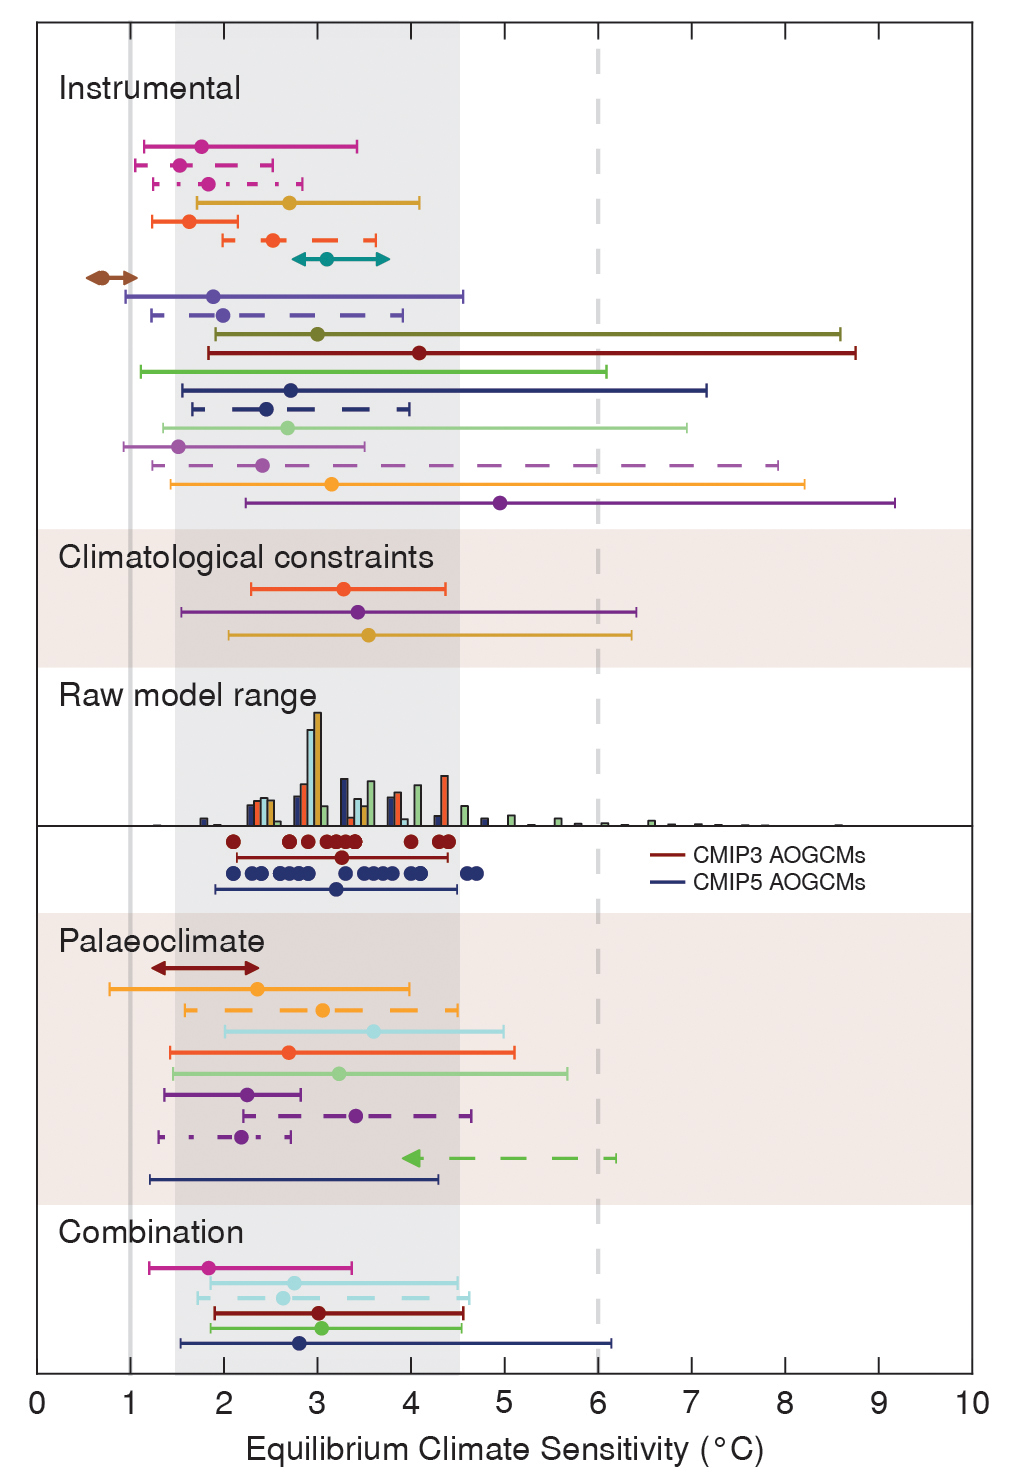
TFE.6, Figure 1
Probability density functions, distributions and ranges for equi- librium climate sensitivity, based on Figure 10.20b plus climatological constraints shown in IPCC AR4 (Box AR4 10.2 Figure 1), and results from CMIP5 (Table 9.5). The grey shaded range marks the likely 1.5°C to 4.5°C range, grey solid line the extremely unlikely less than 1°C, the grey dashed line the very unlikely greater than 6°C. See Figure 10.20b and Chapter 10 Supplementary Material for full caption and details. {Box 12.2, Figure 1}
You may freely download and copy the material contained on this website for your personal, non-commercial use, without any right to resell, redistribute, compile or create derivative works therefrom, subject to more specific restrictions that may apply to specific materials.