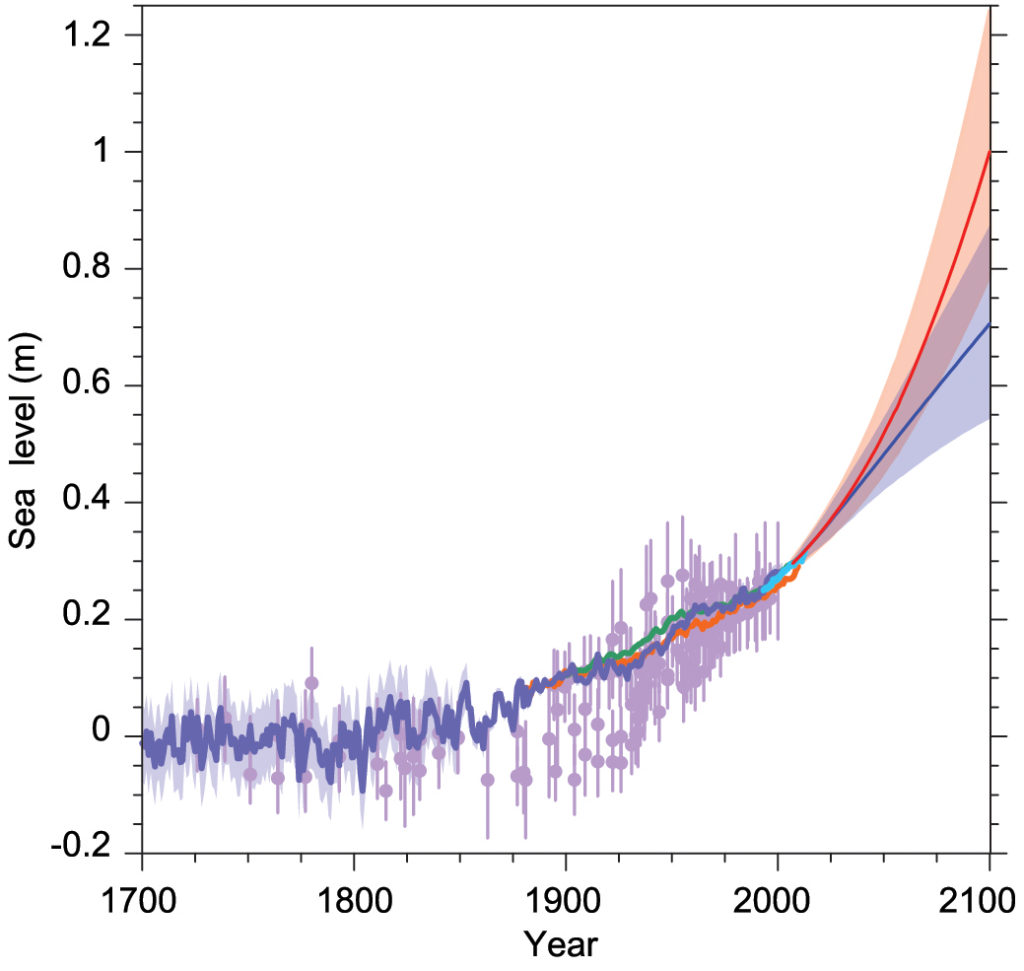
TFE.2, Figure 2
Compilation of paleo sea level data (purple), tide gauge data (blue, red and green), altimeter data (light blue) and central estimates and likely ranges for projections of global mean sea level rise from the combination of CMIP5 and process-based models for RCP2.6 (blue) and RCP8.5 (red) scenarios, all relative to pre-industrial values. {Figures 13.3, 13.11, 13.27}
You may freely download and copy the material contained on this website for your personal, non-commercial use, without any right to resell, redistribute, compile or create derivative works therefrom, subject to more specific restrictions that may apply to specific materials.
Share