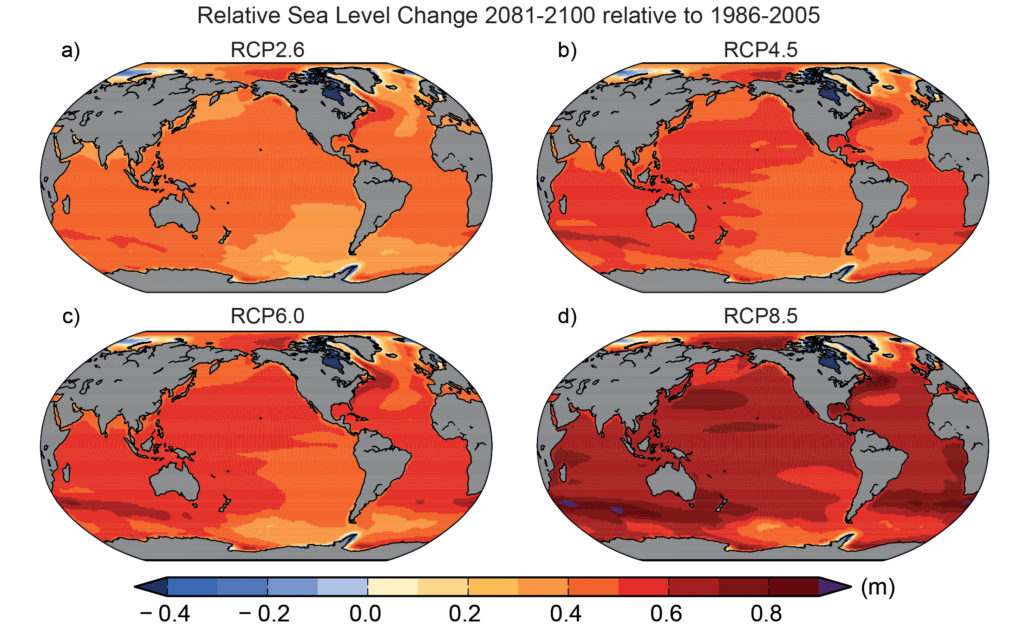
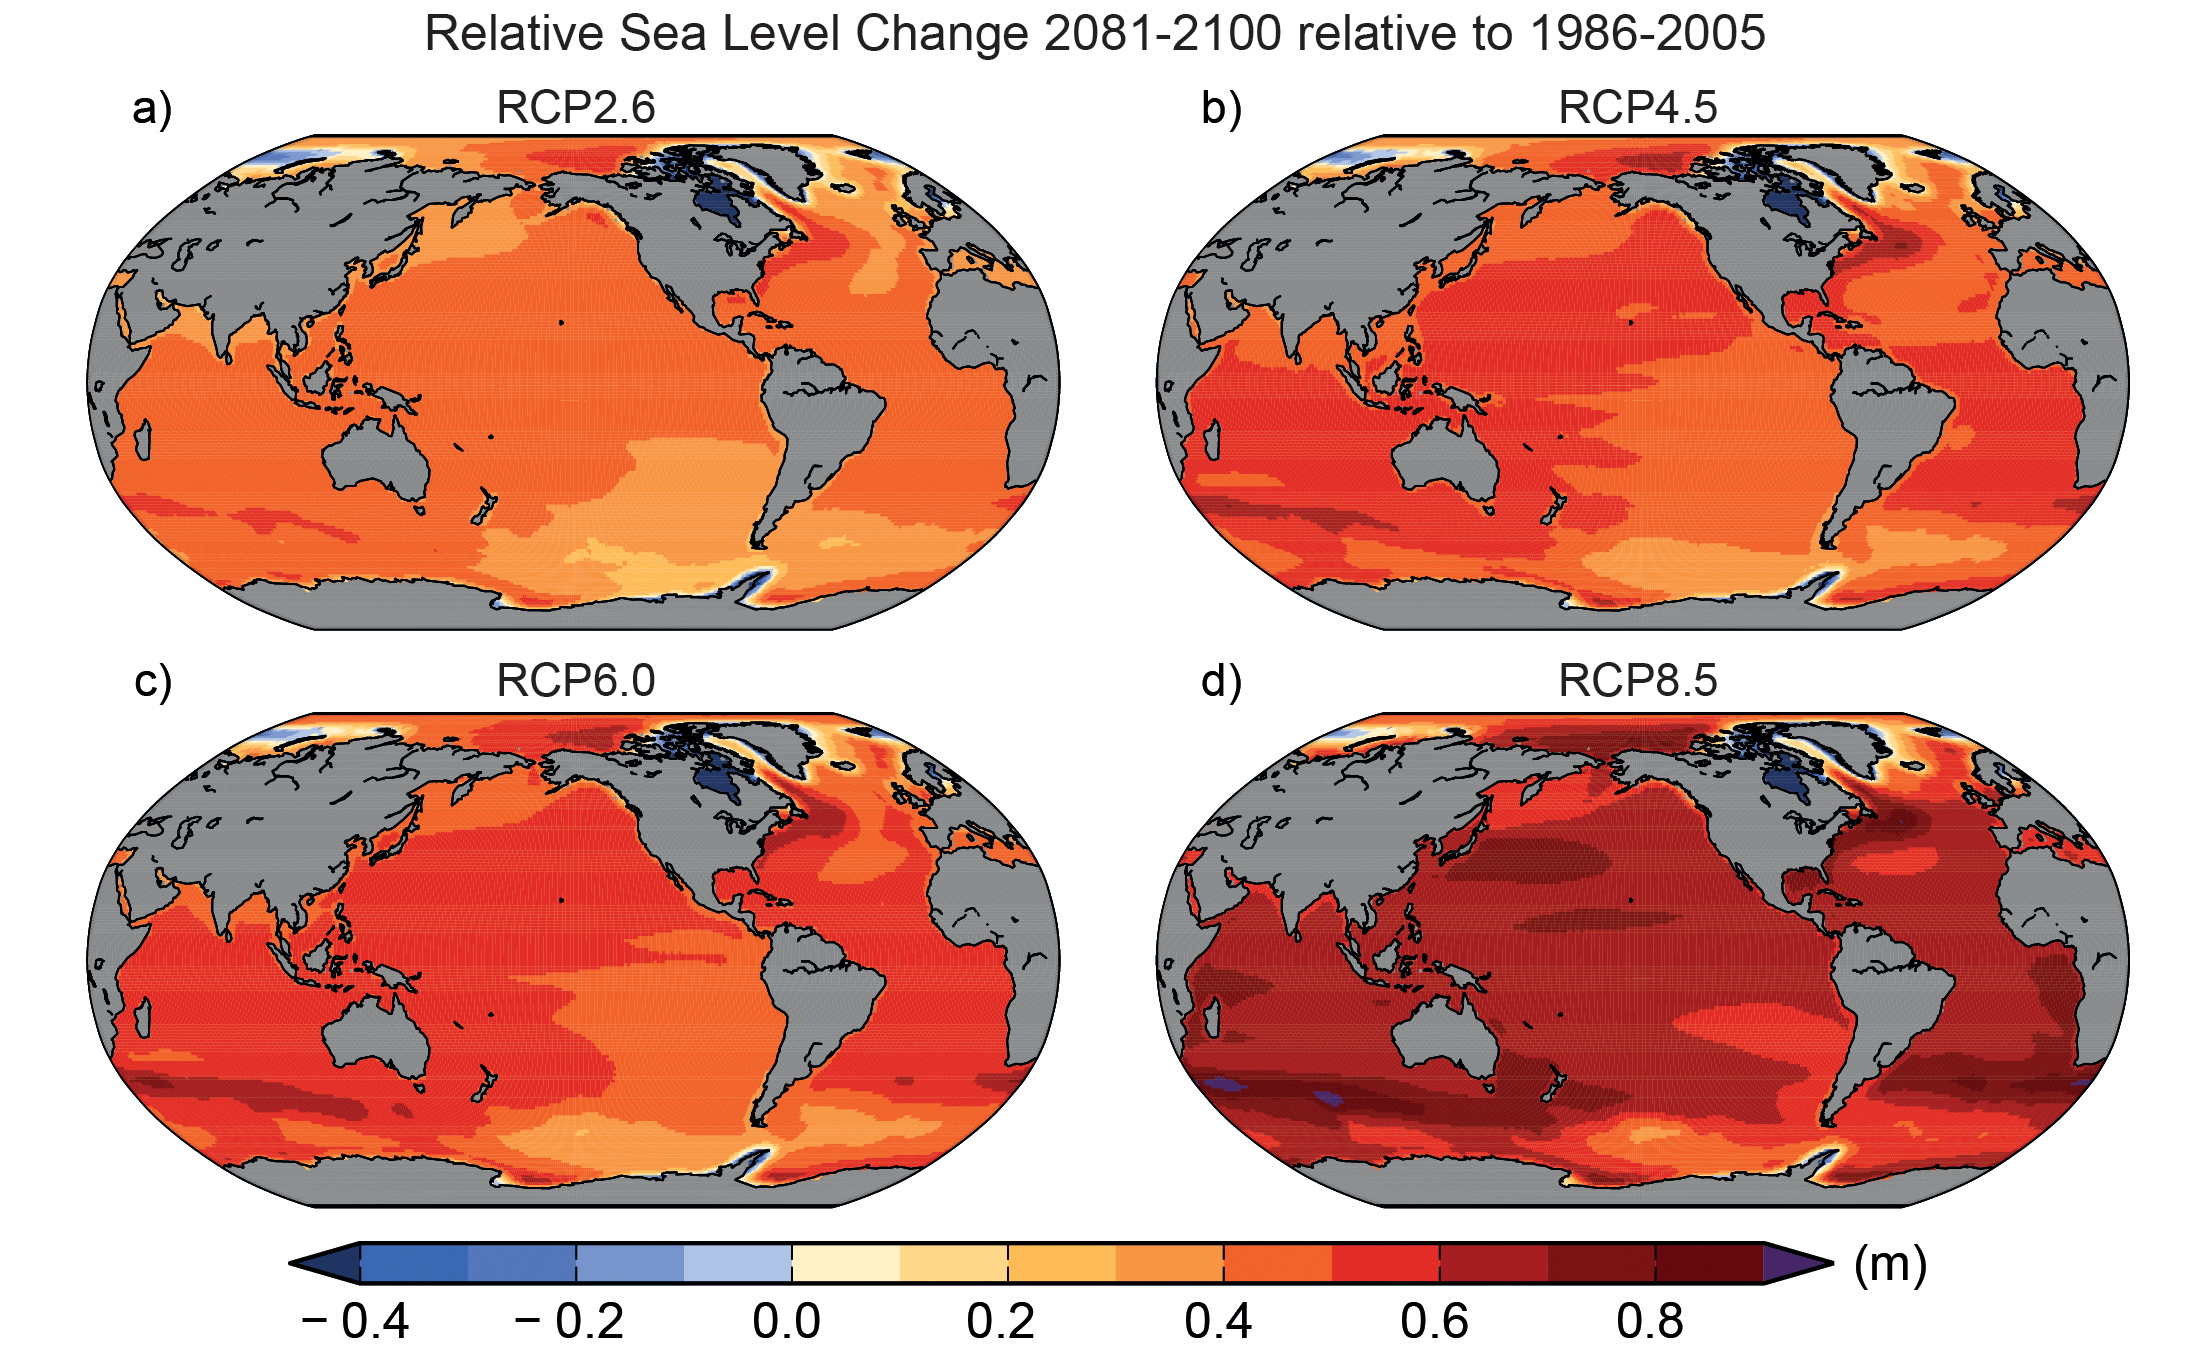
Figure TS.23
Ensemble mean net regional relative sea level change (metres) evaluated from 21 CMIP5 models for the RCP scenarios (a) 2.6, (b) 4.5, (c) 6.0 and (d) 8.5 between 1986–2005 and 2081–2100. Each map includes effects of atmospheric loading, plus land-ice, glacial isostatic adjustment (GIA) and terrestrial water sources. {Figure 13.20}
You may freely download and copy the material contained on this website for your personal, non-commercial use, without any right to resell, redistribute, compile or create derivative works therefrom, subject to more specific restrictions that may apply to specific materials.
You may freely download and copy the material contained on this website for your personal, non-commercial use, without any right to resell, redistribute, compile or create derivative works therefrom, subject to more specific restrictions that may apply to specific materials.