
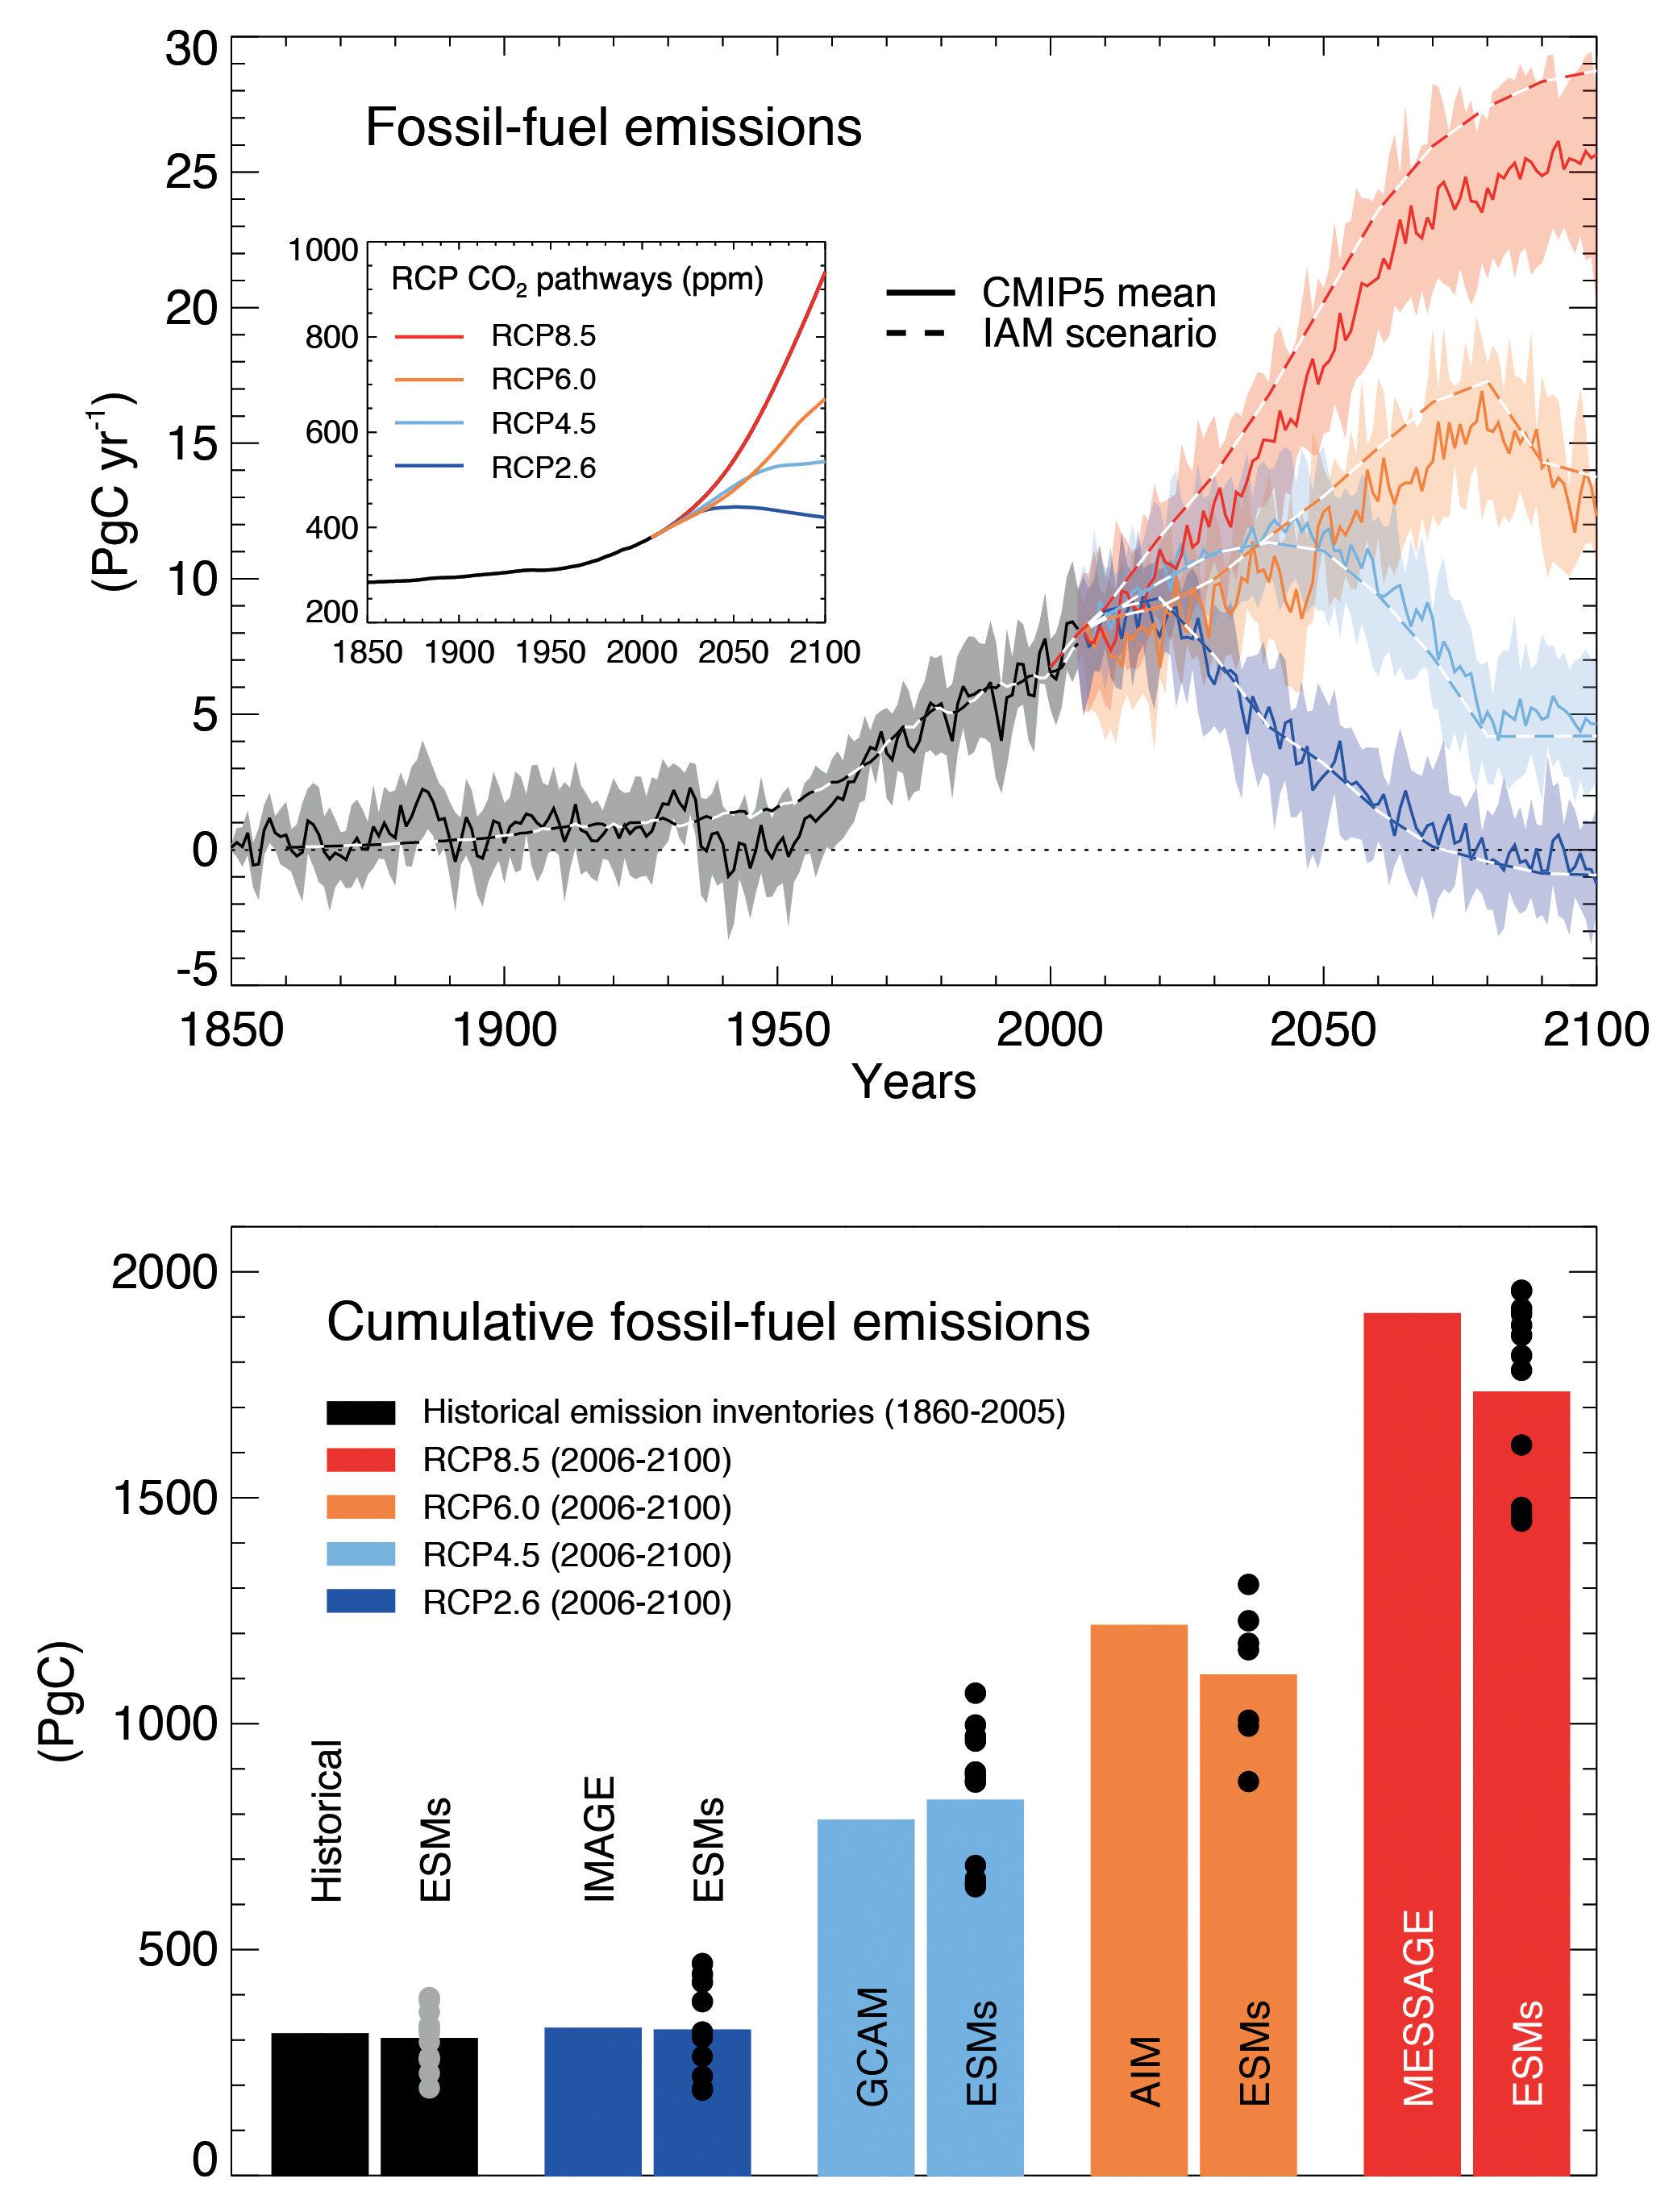
Figure TS.19
Compatible fossil fuel emissions simulated by the CMIP5 models for the four RCP scenarios. (Top) Time series of annual emission (PgC yr–1). Dashed lines represent the historical estimates and RCP emissions calculated by the Integrated Assessment Models (IAMs) used to define the RCP scenarios, solid lines and plumes show results from CMIP5 Earth System Models (ESMs, model mean, with one standard deviation shaded). (Bottom) Cumulative emissions for the historical period (1860–2005) and 21st century (defined in CMIP5 as 2006–2100) for historical estimates and RCP scenarios. Left bars are cumulative emissions from the IAMs, right bars are the CMIP5 ESMs multi-model mean estimate and dots denote individual ESM results. From the CMIP5 ESMs results, total carbon in the land-atmosphere–ocean system can be tracked and changes in this total must equal fossil fuel emissions to the system. Hence the compatible emissions are given by cumulative emissions = ΔCA + ΔCL + ΔCO , while emission rate = d/dt [CA +CL + CO], where CA, CL, CO are carbon stored in atmosphere, land and ocean respectively. Other sources and sinks of CO2 such as from volcanism, sedimentation or rock weathering, which are very small on centennial time scales are not considered here. {Box 6.4; Figure 6.25}
You may freely download and copy the material contained on this website for your personal, non-commercial use, without any right to resell, redistribute, compile or create derivative works therefrom, subject to more specific restrictions that may apply to specific materials.