
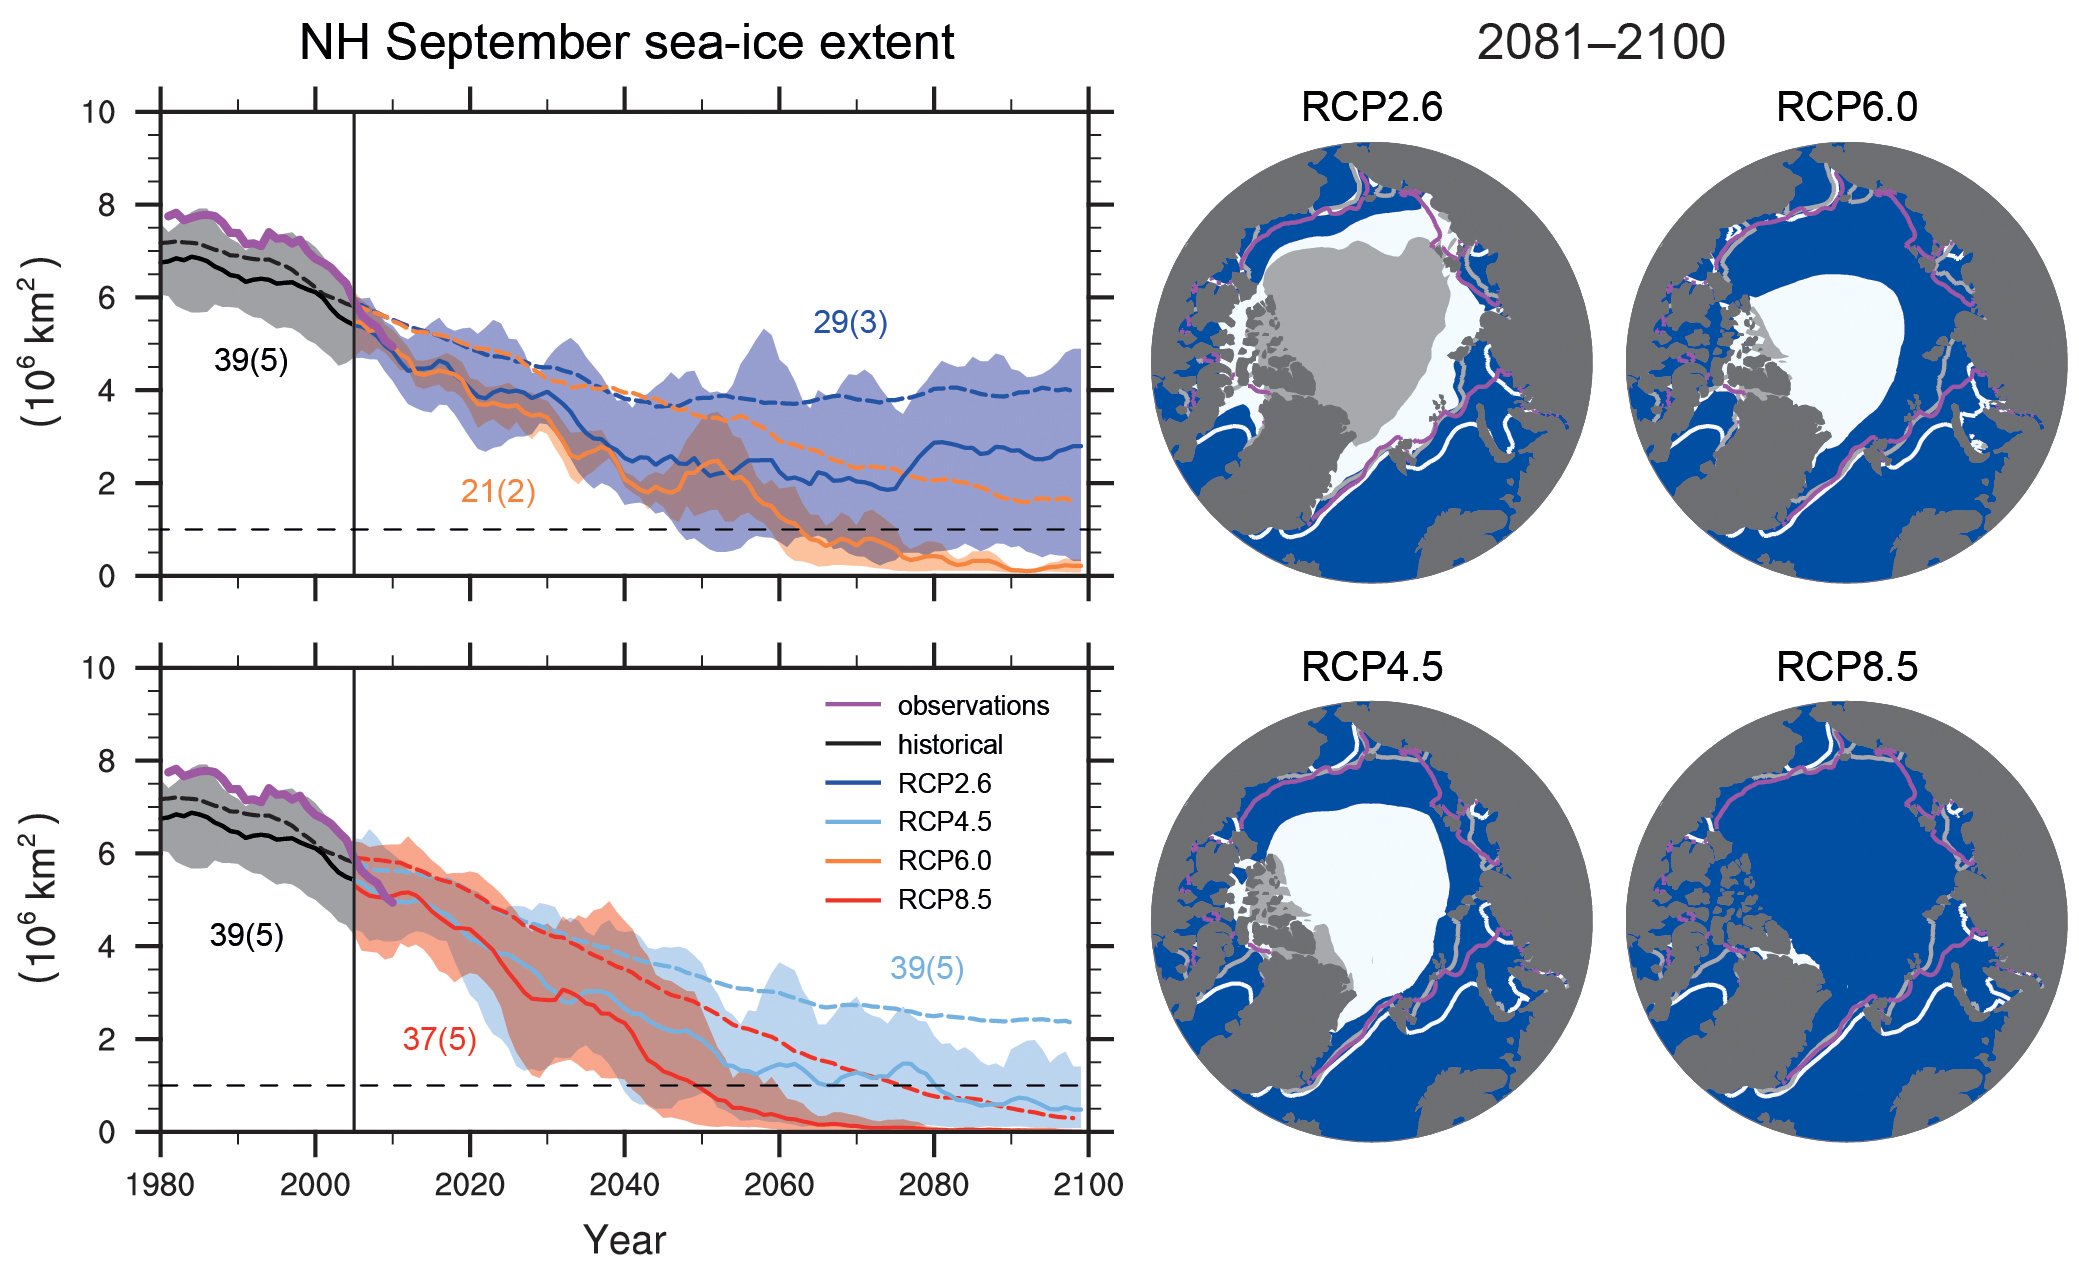
Figure TS.17
Northern Hemisphere (NH) sea ice extent in September over the late 20th century and the whole 21st century for the scenarios RCP2.6, RCP4.5, RCP6.0 and RCP8.5 in the CMIP5 models, and corresponding maps of multi-model results in 2081–2100 of NH September sea ice extent. In the time series, the number of CMIP5 models to calculate the multi-model mean is indicated (subset in brackets). Time series are given as 5-year running means. The projected mean sea ice extent of a subset of models that most closely reproduce the climatological mean state and 1979–2012 trend of the Arctic sea ice is given (solid lines), with the minimum to maximum range of the subset indicated with shading. Black (grey shading) is the modelled historical evolution using historical reconstructed forcings. The CMIP5 multi-model mean is indicated with dashed lines. In the maps, the CMIP5 multi-model mean is given in white and the results for the subset in grey. Filled areas mark the averages over the 2081–2100 period, lines mark the sea ice extent averaged over the 1986–2005 period. The observed sea ice extent is given in pink as a time series and averaged over 1986–2005 as a pink line in the map. Further detail regarding the related Figures SPM.7b and SPM.8c is given in the TS Supplementary Material. {Figures 12.18, 12.29, 12.31}
You may freely download and copy the material contained on this website for your personal, non-commercial use, without any right to resell, redistribute, compile or create derivative works therefrom, subject to more specific restrictions that may apply to specific materials.