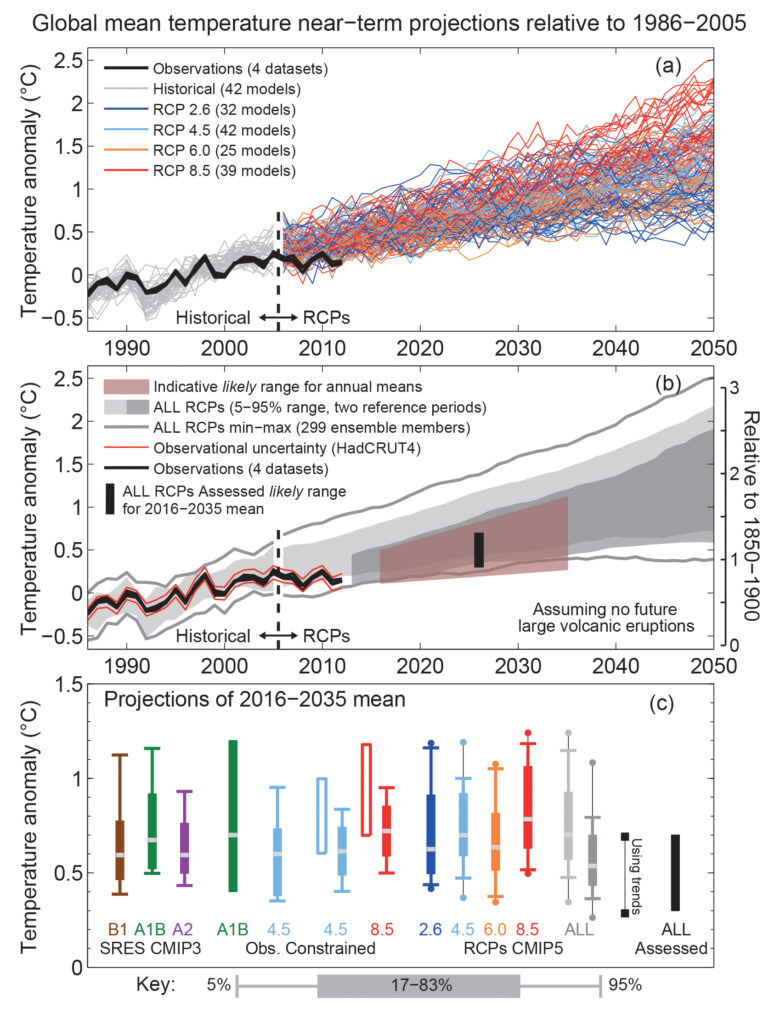
Figure TS.14
Synthesis of near-term projections of global mean surface air temperature (GMST). (a) Projections of annual mean GMST 1986–2050 (anomalies relative to 1986–2005) under all RCPs from CMIP5 models (grey and coloured lines, one ensemble member per model), with four observational estimates (Hadley Centre/Climatic Research Unit gridded surface temperature data set 4 (HadCRUT4), European Centre for Medium Range Weather Forecasts (ECMWF) interim re-analysis of the global atmosphere and surface conditions (ERA-Interim), Goddard Institute for Space Studies Surface Temperature Analysis (GISTEMP), National Oceanic and Atmospheric Administration (NOAA)) for the period 1986–2012 (black lines). (b) As (a) but showing the 5 to 95% range of annual mean CMIP5 projections (using one ensemble member per model) for all RCPs using a reference period of 1986–2005 (light grey shade) and all RCPs using a reference period of 2006–2012, together with the observed anomaly for (2006–2012) minus (1986–2005) of 0.16°C (dark grey shade). The percentiles for 2006 onwards have been smoothed with a 5-year running mean for clarity. The maximum and minimum values from CMIP5 using all ensemble members and the 1986–2005 reference period are shown by the grey lines (also smoothed). Black lines show annual mean observational estimates. The red shaded region shows the indicative likely range for annual mean GMST during the period 2016–2035 based on the ‘ALL RCPs Assessed’ likely range for the 20-year mean GMST anomaly for 2016–2035, which is shown as a black bar in both (b) and (c) (see text for details). The temperature scale relative to 1850-1900 mean climate on the right-hand side assumes a warming of GMST prior to 1986–2005 of 0.61°C estimated from HadCRUT4. (c) A synthesis of projections for the mean GMST anomaly for 2016–2035 relative to 1986–2005. The box and whiskers represent the 66% and 90% ranges. Shown are: unconstrained SRES CMIP3 and RCP CMIP5 projections; observationally constrained projections for the SRES A1B and, the RCP4.5 and 8.5 scenarios; unconstrained projections for all four RCP scenarios using two reference periods as in (b) (light grey and dark grey shades), consistent with (b); 90% range estimated using CMIP5 trends for the period 2012–2035 and the observed GMST anomaly for 2012; an overall likely (>66%) assessed range for all RCP scenarios. The dots for the CMIP5 estimates show the maximum and minimum values using all ensemble members. The medians (or maximum likelihood estimate; green filled bar) are indicated by a grey band. (Adapted from Figure 11.25.) See Section 11.3.6 for details. {Figure 11.25}
You may freely download and copy the material contained on this website for your personal, non-commercial use, without any right to resell, redistribute, compile or create derivative works therefrom, subject to more specific restrictions that may apply to specific materials.