
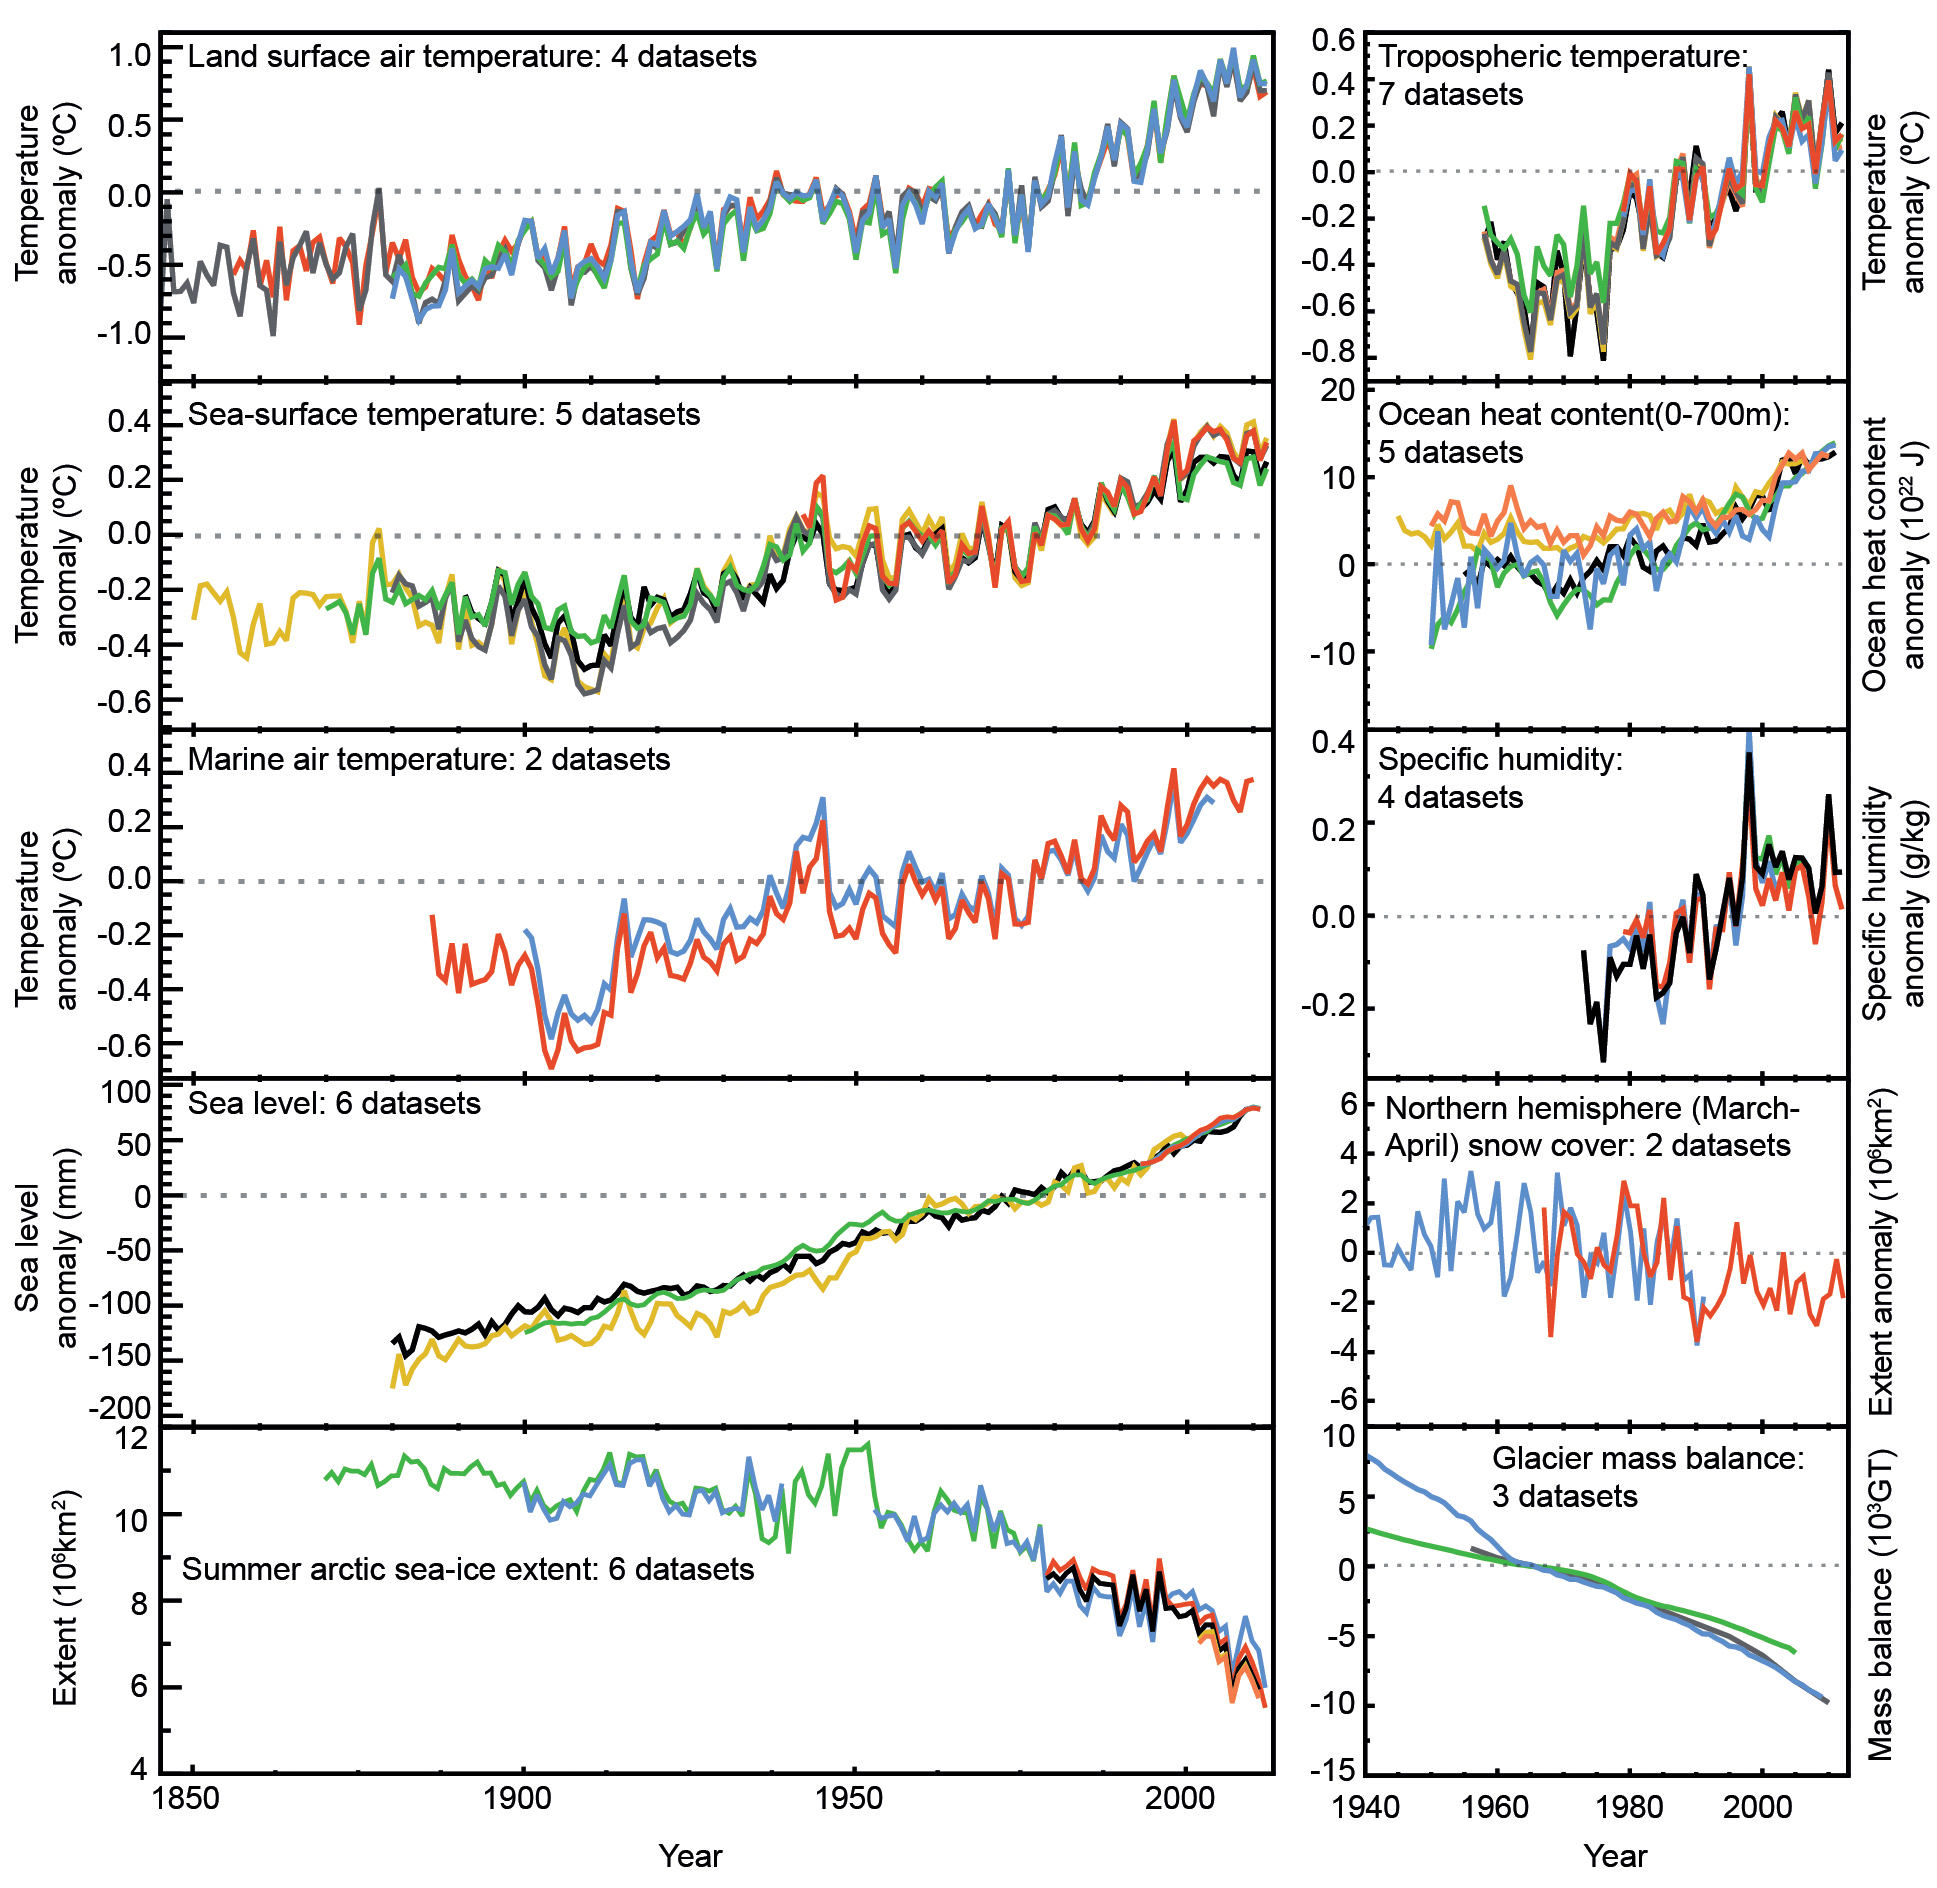
Figure TS.1
Multiple complementary indicators of a changing global climate. Each line represents an independently derived estimate of change in the climate element. The times series presented are assessed in Chapters 2, 3 and 4. In each panel all data sets have been normalized to a common period of record. A full detailing of which source data sets go into which panel is given in Chapter 2 Supplementary Material Section 2.SM.5 and in the respective chapters. Further detail regarding the related Figure SPM.3 is given in the TS Supplementary Material. {FAQ 2.1, Figure 1; 2.4, 2.5, 3.2, 3.7, 4.5.2, 4.5.3}
You may freely download and copy the material contained on this website for your personal, non-commercial use, without any right to resell, redistribute, compile or create derivative works therefrom, subject to more specific restrictions that may apply to specific materials.