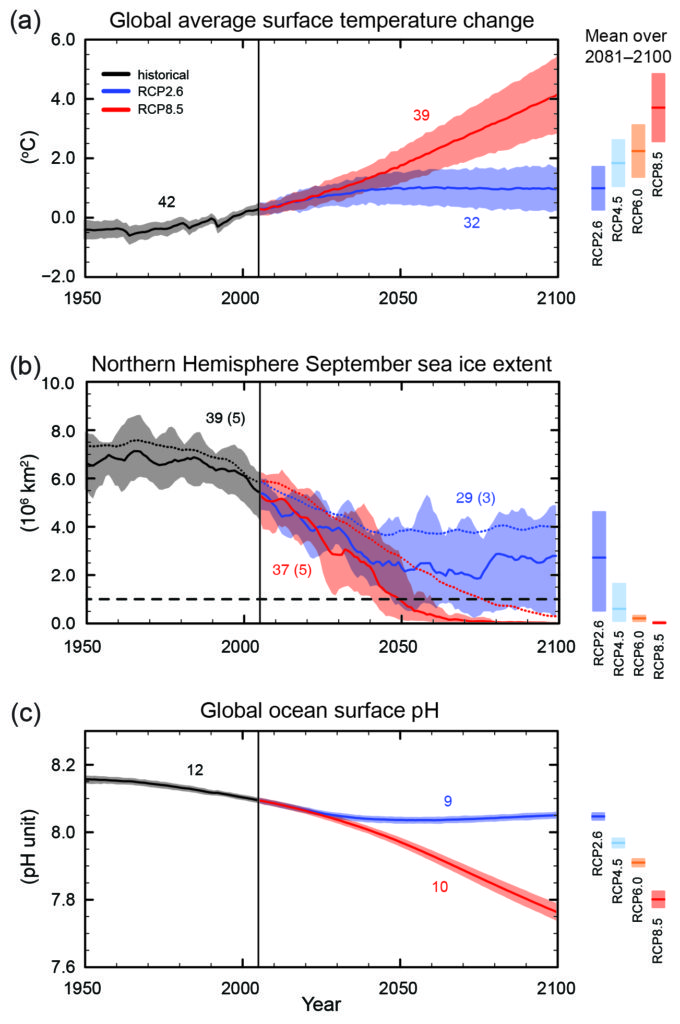
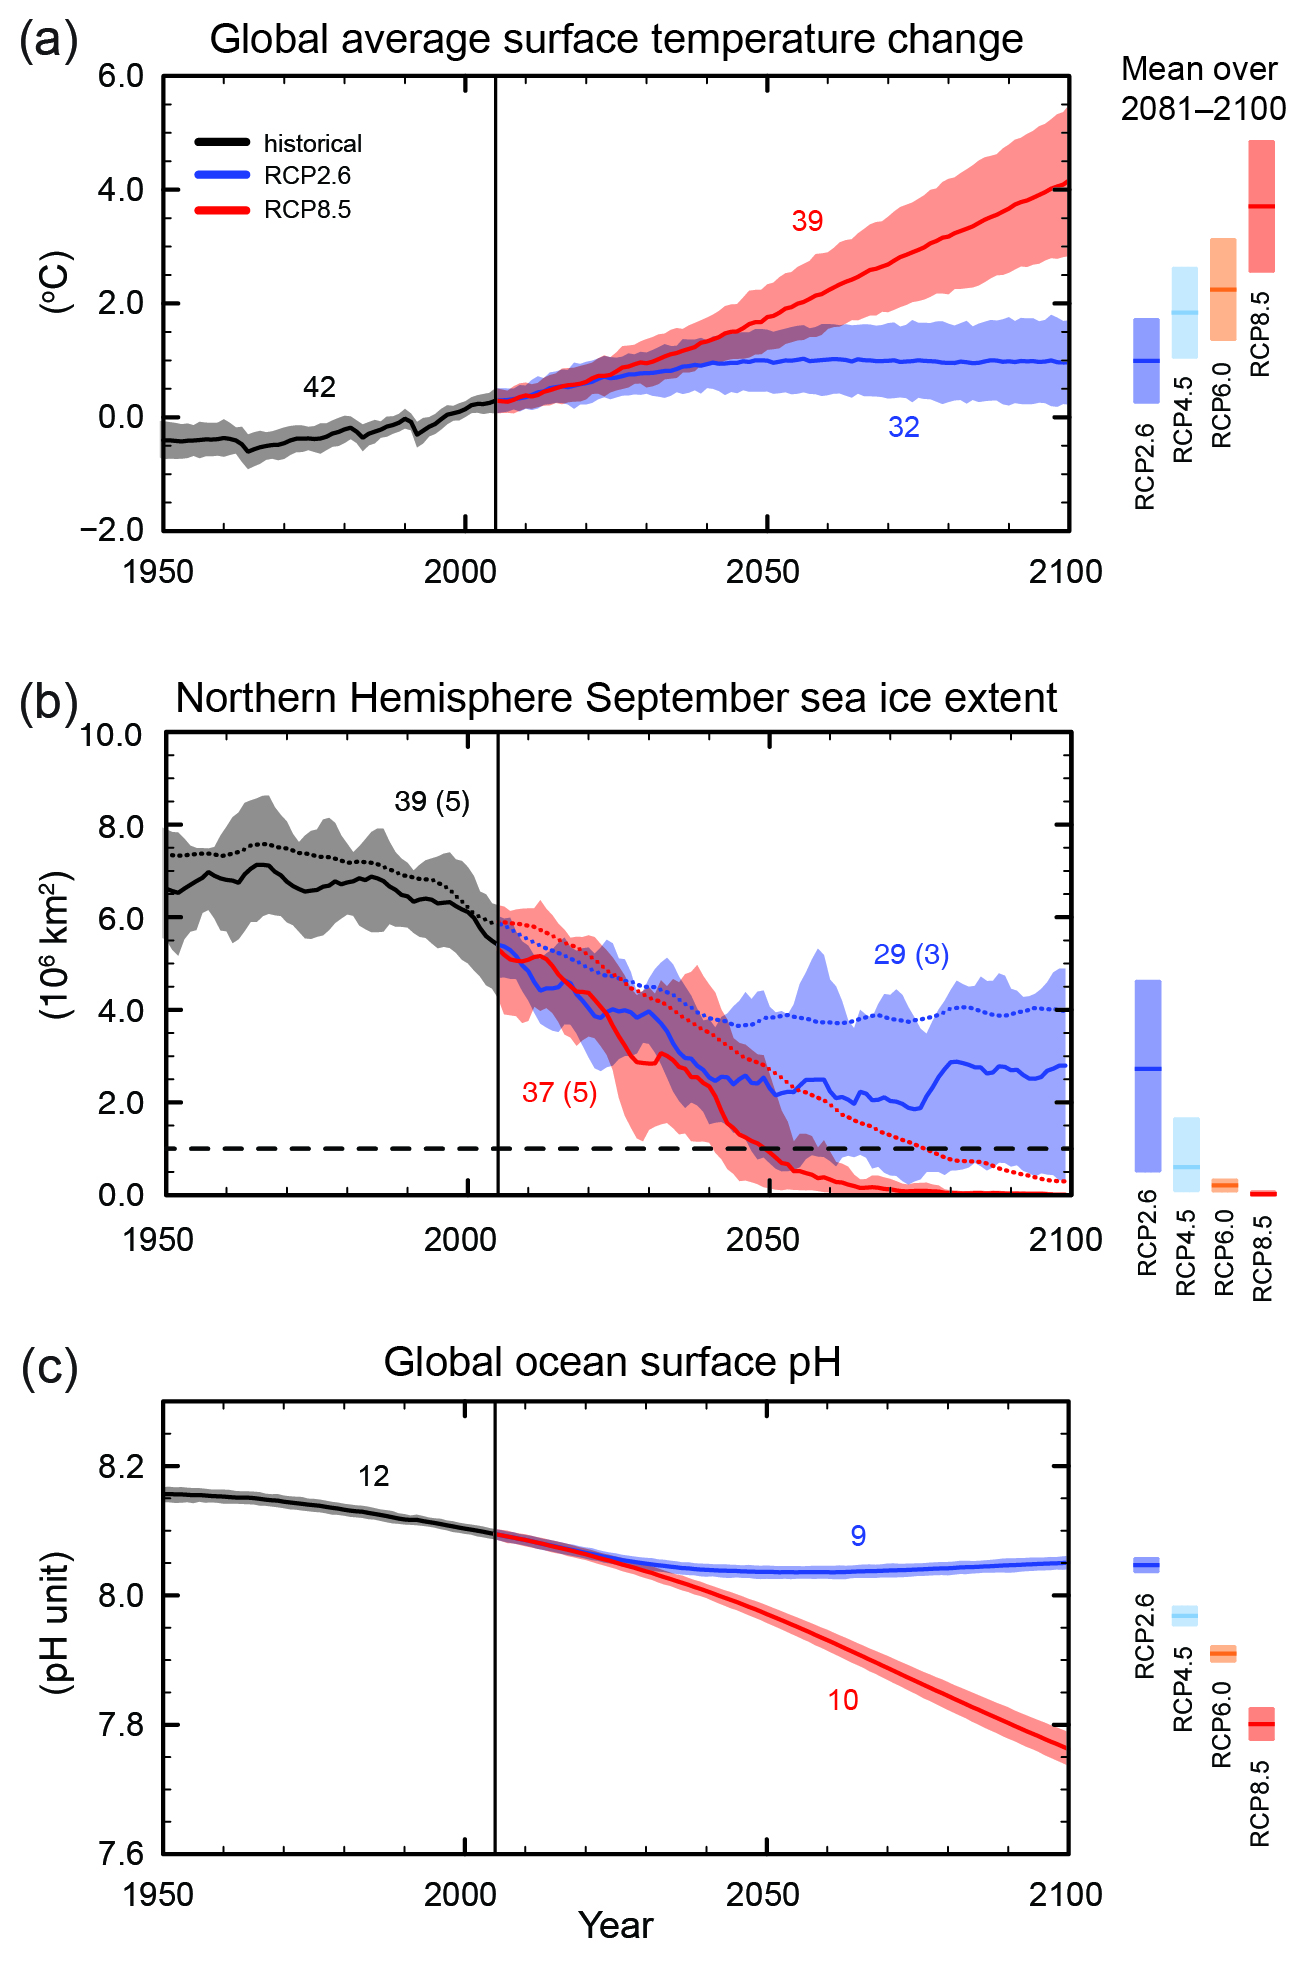
Figure SPM.7
CMIP5 multi-model simulated time series from 1950 to 2100 for (a) change in global annual mean surface temperature relative to 1986–2005, (b) Northern Hemisphere September sea ice extent (5-year running mean), and (c) global mean ocean surface pH. Time series of projections and a measure of uncertainty (shading) are shown for scenarios RCP2.6 (blue) and RCP8.5 (red). Black (grey shading) is the modelled historical evolution using historical reconstructed forcings. The mean and associated uncertainties averaged over 2081−2100 are given for all RCP scenarios as colored verti- cal bars. The numbers of CMIP5 models used to calculate the multi-model mean is indicated. For sea ice extent (b), the projected mean and uncertainty (minimum-maximum range) of the subset of models that most closely reproduce the climatological mean state and 1979 to 2012 trend of the Arctic sea ice is given (number of models given in brackets). For completeness, the CMIP5 multi-model mean is also indicated with dotted lines. The dashed line represents nearly ice-free conditions (i.e., when sea ice extent is less than 106 km2 for at least five consecutive years). For further technical details see the Technical Summary Supplementary Material {Figures 6.28, 12.5, and 12.28–12.31; Figures TS.15, TS.17, and TS.20}
You may freely download and copy the material contained on this website for your personal, non-commercial use, without any right to resell, redistribute, compile or create derivative works therefrom, subject to more specific restrictions that may apply to specific materials.