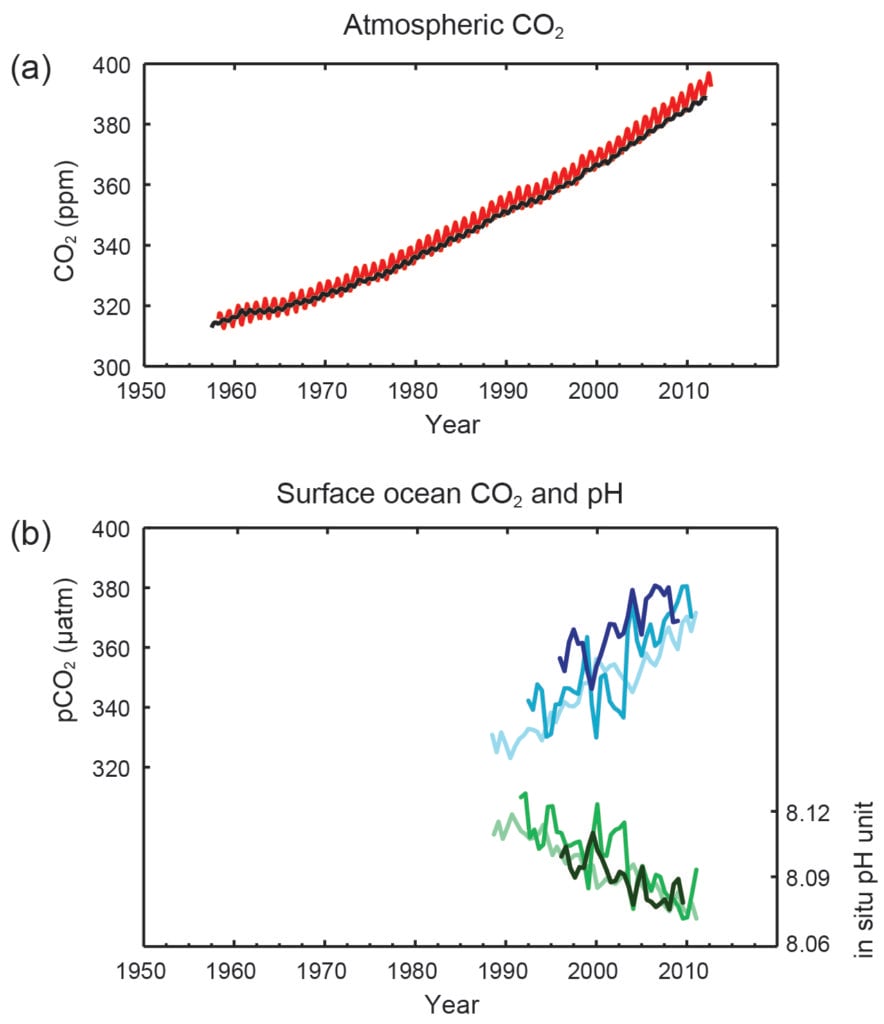
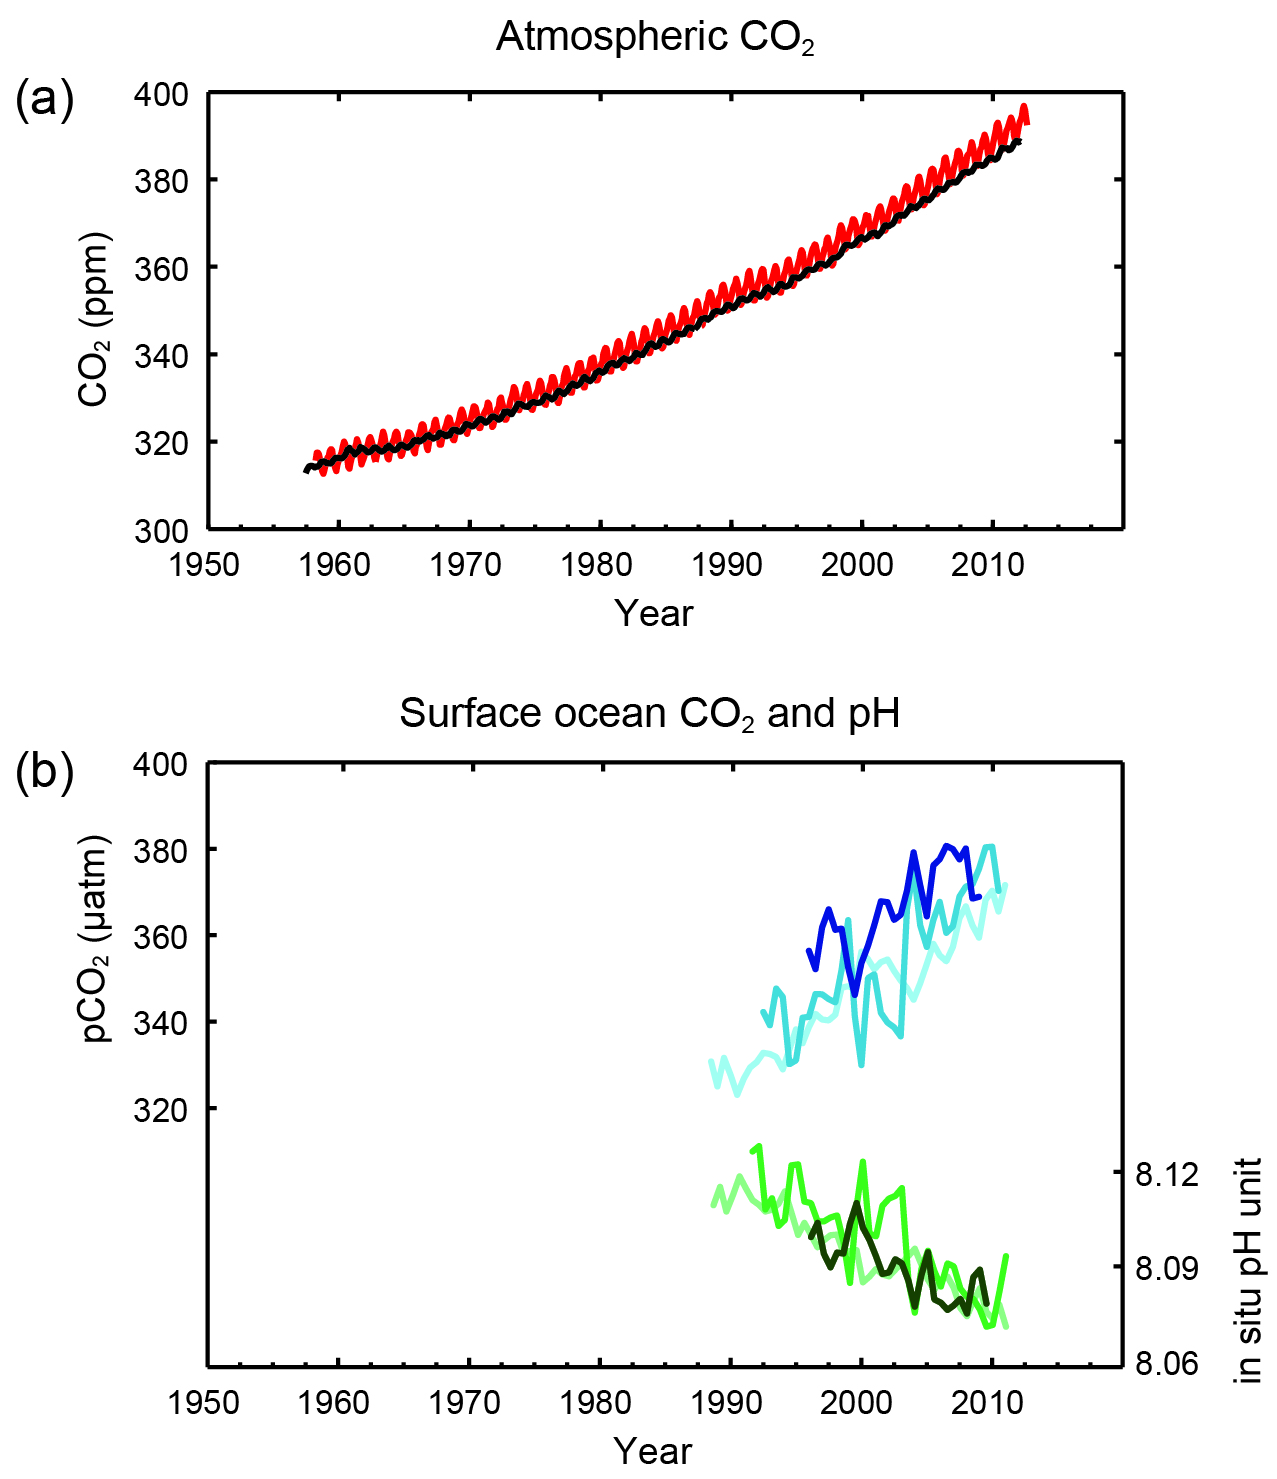
Figure SPM.4
Multiple observed indicators of a changing global carbon cycle: (a) atmospheric concentrations of carbon dioxide (CO2) from Mauna Loa (19°32’N, 155°34’W – red) and South Pole (89°59’S, 24°48’W – black) since 1958; (b) partial pressure of dissolved CO2 at the ocean surface (blue curves) and in situ pH (green curves), a measure of the acidity of ocean water. Measurements are from three stations from the Atlantic (29°10’N, 15°30’W – dark blue/dark green; 31°40’N, 64°10’W – blue/green) and the Pacific Oceans (22°45’N, 158°00’W − light blue/light green). Full details of the datasets shown here are provided in the underlying report and the Technical Summary Supplementary Material. {Figures 2.1 and 3.18; Figure TS.5}
You may freely download and copy the material contained on this website for your personal, non-commercial use, without any right to resell, redistribute, compile or create derivative works therefrom, subject to more specific restrictions that may apply to specific materials.